


The USGS provides research-quality, applications-ready Landsat Level-2 and Level-3 science products to support an array of land surface change studies. Collection 2 Level-2 scene-based science products include Surface Reflectance, Surface Temperature, Surface Reflectance-Derived Spectral Indices, and Provisional Aquatic Reflectance.
What Landsat products are available?
There are several Landsat Collection 2 products that are useful for science applications and land use/land change studies:
Landsat Level-1 Products - Each Level-1 product includes individual spectral band files, a metadata file, and additional ancillary files. Level-1 products are available for all global landmasses.
Landsat U.S. Analysis Ready Data (ARD) - U.S. ARD uses Landsat Level-1 data as input that is processed to the highest scientific standards and placed in a tile-based structure to support time-series analysis.
U.S. ARD are available for the conterminous United States (CONUS), Alaska, and Hawaii. Landsat Collection 2 U.S. ARD products are processed to a common tiling scheme, which is modified from the Web-Enabled Landsat Data (WELD) system. This tiled grid is different from the Landsat satellites path and row.
Landsat Level-2 and Level-3 Science Products – Landsat science products are processed time-series observational data of sufficient length, consistency, and continuity to record effects of climate change.
Landsat Level-2 Science Products are available for global landmasses and include: surface reflectance, surface temperature, surface reflectance-derived spectral indices, and provisional aquatic reflectance.
Product availability for Landsat Level-3 Science Products varies by product:
U.S. ARD tile-based:
- Dynamic surface water extent: CONUS, AK, HI
- Fractional snow covered area: Northern and western CONUS, AK
- Burned area: CONUS
Landsat Path/Row scene-based:
- Provisional actual evapotranspiration: Global coverage
Learn more:
Related
What are U.S. Landsat Analysis Ready Data (ARD)?
U.S. Landsat Analysis Ready Data (ARD) are pre-packaged and pre-processed bundles of Landsat data products that make the Landsat archive more accessible and easier to analyze, and reduce the amount of time users spend on data processing for time-series analysis. ARD contains Level-2 products derived from Landsat Collections Level-1 scenes. ARD are tiled, georegistered, top of atmosphere, and...
What are Landsat Collections?
In 2016, the USGS reorganized the Landsat archive into a tiered collection. This structure ensures that Landsat Level-1 products provide a consistent archive of known data quality to support time-series analyses and data “stacking”, while controlling continuous improvement of the archive and access to all data as they are acquired. Learn more: Landsat Collections Landsat Data Access
What are Landsat Collection Tiers?
Landsat Collection Tiers are the inventory structure for Level-1 data products and are based on data quality and level of processing. The tier definition purpose is to support easier identification of suitable scenes for time-series pixel-level analysis, and provide temporary data that are processed immediately upon downlink to be dispensed quickly in emergency response situations with limited...
How can I tell the difference between Landsat Collections data and Landsat data I have downloaded in the past?
Data that is processed to meet Collections specifications has a Landsat Product Identifier, as opposed to the historical Landsat Scene ID. Along with information inherited from the Scene ID, the Landsat Product Identifier includes the processing level, processing date, collection number, and collection category (bolded below). Scene ID Landsat Product Identifier LXSPPPRRRYYYYDDDGSIVV LXSS_LLL...
How do I open Landsat satellite data files?
Many image processing programs can handle GeoTIFF and Cloud optimized GeoTIFF (COG) Landsat files, including free software like Multispec and QGIS. To view Landsat scenes without using specialized software, download Landsat Full Resolution browse images (.jpg) from EarthExplorer or GloVis. * The USGS does NOT endorse or support specific software packages. Any usability questions relating to...
Are there any restrictions on the use or redistribution of Landsat data?
There are no restrictions on Landsat data downloaded from the USGS; it can be used or redistributed as desired. We do request that you include a statement of the data source when citing, copying, or reprinting USGS Landsat data or images. Details are on the EROS Data Citation page. Learn more: USGS Copyrights and Credits statement
What is the Landsat satellite program and why is it important?
The Landsat Program is a series of Earth-observing satellite missions jointly managed by NASA and the U.S. Geological Survey. On July 23, 1972, in cooperation with NASA, the Earth Resources Technology Satellite (ERTS-1) was launched. It was later renamed Landsat 1. Additional Landsat satellites have launched to bring the world an archive of remote sensing data. Currently orbiting and active...
How do I search for and download Landsat data?
Landsat data products held in the USGS archives can be searched and downloaded at no charge from a variety of sources. Visit Landsat Data Access for information about how Landsat data products can be downloaded individually or in bulk. Landsat imagery not found in the USGS archive might have been collected by one of the USGS International Cooperator ground stations, each of which are the primary...

Landsat Collection 2 Level-2 Science Products
The USGS provides research-quality, applications-ready Landsat Level-2 and Level-3 science products to support an array of land surface change studies. Collection 2 Level-2 scene-based science products include Surface Reflectance, Surface Temperature, Surface Reflectance-Derived Spectral Indices, and Provisional Aquatic Reflectance.

Landsat 9 Image of Phoenix Metropolitan Area
The Phoenix, Arizona metropolitan area, also known as the Valley of the Sun, is comprised of more than 14,600 square miles and is considered the largest metropolitan area in the southwestern United States. The desert climate and abundant sunshine of the area are main factors in population growth and urban sprawl.
The Phoenix, Arizona metropolitan area, also known as the Valley of the Sun, is comprised of more than 14,600 square miles and is considered the largest metropolitan area in the southwestern United States. The desert climate and abundant sunshine of the area are main factors in population growth and urban sprawl.

Landsat 8 image of the Salton Sea 2023
This Landsat 8 image shows the Salton Sea and surrounding area in California.
Landsat 8
Path 39 Row 37
October 18, 2023
Bands 6,5,4
This Landsat 8 image shows the Salton Sea and surrounding area in California.
Landsat 8
Path 39 Row 37
October 18, 2023
Bands 6,5,4

Landsat Collections
Landsat Collections: Providing a Stable Environmental Record for Time Series Analysis
Landsat Collections: Providing a Stable Environmental Record for Time Series Analysis
")
Landsat Analysis Ready Data (ARD)
The U.S. Geological Survey (USGS) has improved Landsat data quality and usability through the creation of Analysis Ready Data (ARD) for the conterminous United States, Alaska, and Hawaii. Landsat ARD greatly reduces the preparatory work currently required to do time-series analysis for understanding landscape change for operational and science users.
The U.S. Geological Survey (USGS) has improved Landsat data quality and usability through the creation of Analysis Ready Data (ARD) for the conterminous United States, Alaska, and Hawaii. Landsat ARD greatly reduces the preparatory work currently required to do time-series analysis for understanding landscape change for operational and science users.

Landsat Collections — What are Tiers?
This is the third video in a series describing the new U.S. Geological Survey (USGS) Landsat Collection 1 inventory structure. Collection 1 required the reprocessing of all archived Landsat data to achieve radiometric and geometric consistency of Level-1 products through time and across all Landsat sensors.
This is the third video in a series describing the new U.S. Geological Survey (USGS) Landsat Collection 1 inventory structure. Collection 1 required the reprocessing of all archived Landsat data to achieve radiometric and geometric consistency of Level-1 products through time and across all Landsat sensors.

Landsat Collections - RMSE
Landsat Collections: Providing a Stable Environment Record for Time Series Analysis
Landsat Collections: Providing a Stable Environment Record for Time Series Analysis
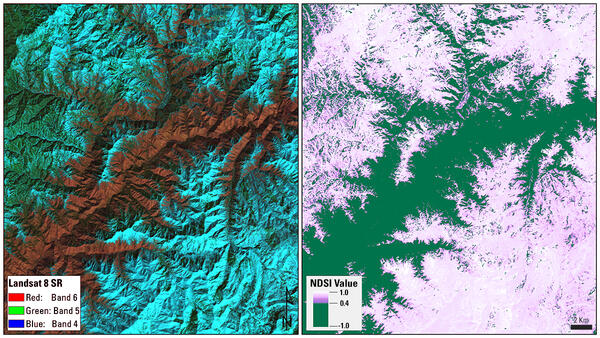
Example of Landsat Collection 2 Normalized Difference Snow Index
This graphic shows an example of the Landsat Collection 2 Normalized Difference Snow Index (NDSI) in the Boise National Forest, Idaho. Left: Landsat Collection 2 Surface Reflectance; Right: Landsat Collection 2 NDSI
This graphic shows an example of the Landsat Collection 2 Normalized Difference Snow Index (NDSI) in the Boise National Forest, Idaho. Left: Landsat Collection 2 Surface Reflectance; Right: Landsat Collection 2 NDSI

Example of Landsat 8 OLI/TIRS Collection 2 level-2 science products
Example of the Landsat 8 OLI/TIRS Collection 2 level-2 science products. Left: Landsat 8 level-2 surface reflectance image. Right: Landsat 8 level-2 surface temperature image. The data was acquired on May 3, 2013 (path 140 row 41).
Example of the Landsat 8 OLI/TIRS Collection 2 level-2 science products. Left: Landsat 8 level-2 surface reflectance image. Right: Landsat 8 level-2 surface temperature image. The data was acquired on May 3, 2013 (path 140 row 41).
Related
What are U.S. Landsat Analysis Ready Data (ARD)?
U.S. Landsat Analysis Ready Data (ARD) are pre-packaged and pre-processed bundles of Landsat data products that make the Landsat archive more accessible and easier to analyze, and reduce the amount of time users spend on data processing for time-series analysis. ARD contains Level-2 products derived from Landsat Collections Level-1 scenes. ARD are tiled, georegistered, top of atmosphere, and...
What are Landsat Collections?
In 2016, the USGS reorganized the Landsat archive into a tiered collection. This structure ensures that Landsat Level-1 products provide a consistent archive of known data quality to support time-series analyses and data “stacking”, while controlling continuous improvement of the archive and access to all data as they are acquired. Learn more: Landsat Collections Landsat Data Access
What are Landsat Collection Tiers?
Landsat Collection Tiers are the inventory structure for Level-1 data products and are based on data quality and level of processing. The tier definition purpose is to support easier identification of suitable scenes for time-series pixel-level analysis, and provide temporary data that are processed immediately upon downlink to be dispensed quickly in emergency response situations with limited...
How can I tell the difference between Landsat Collections data and Landsat data I have downloaded in the past?
Data that is processed to meet Collections specifications has a Landsat Product Identifier, as opposed to the historical Landsat Scene ID. Along with information inherited from the Scene ID, the Landsat Product Identifier includes the processing level, processing date, collection number, and collection category (bolded below). Scene ID Landsat Product Identifier LXSPPPRRRYYYYDDDGSIVV LXSS_LLL...
How do I open Landsat satellite data files?
Many image processing programs can handle GeoTIFF and Cloud optimized GeoTIFF (COG) Landsat files, including free software like Multispec and QGIS. To view Landsat scenes without using specialized software, download Landsat Full Resolution browse images (.jpg) from EarthExplorer or GloVis. * The USGS does NOT endorse or support specific software packages. Any usability questions relating to...
Are there any restrictions on the use or redistribution of Landsat data?
There are no restrictions on Landsat data downloaded from the USGS; it can be used or redistributed as desired. We do request that you include a statement of the data source when citing, copying, or reprinting USGS Landsat data or images. Details are on the EROS Data Citation page. Learn more: USGS Copyrights and Credits statement
What is the Landsat satellite program and why is it important?
The Landsat Program is a series of Earth-observing satellite missions jointly managed by NASA and the U.S. Geological Survey. On July 23, 1972, in cooperation with NASA, the Earth Resources Technology Satellite (ERTS-1) was launched. It was later renamed Landsat 1. Additional Landsat satellites have launched to bring the world an archive of remote sensing data. Currently orbiting and active...
How do I search for and download Landsat data?
Landsat data products held in the USGS archives can be searched and downloaded at no charge from a variety of sources. Visit Landsat Data Access for information about how Landsat data products can be downloaded individually or in bulk. Landsat imagery not found in the USGS archive might have been collected by one of the USGS International Cooperator ground stations, each of which are the primary...
Landsat Collection 2 Level-2 Science Products
The USGS provides research-quality, applications-ready Landsat Level-2 and Level-3 science products to support an array of land surface change studies. Collection 2 Level-2 scene-based science products include Surface Reflectance, Surface Temperature, Surface Reflectance-Derived Spectral Indices, and Provisional Aquatic Reflectance.
The USGS provides research-quality, applications-ready Landsat Level-2 and Level-3 science products to support an array of land surface change studies. Collection 2 Level-2 scene-based science products include Surface Reflectance, Surface Temperature, Surface Reflectance-Derived Spectral Indices, and Provisional Aquatic Reflectance.
Landsat 9 Image of Phoenix Metropolitan Area
The Phoenix, Arizona metropolitan area, also known as the Valley of the Sun, is comprised of more than 14,600 square miles and is considered the largest metropolitan area in the southwestern United States. The desert climate and abundant sunshine of the area are main factors in population growth and urban sprawl.
The Phoenix, Arizona metropolitan area, also known as the Valley of the Sun, is comprised of more than 14,600 square miles and is considered the largest metropolitan area in the southwestern United States. The desert climate and abundant sunshine of the area are main factors in population growth and urban sprawl.
Landsat 8 image of the Salton Sea 2023
This Landsat 8 image shows the Salton Sea and surrounding area in California.
Landsat 8
Path 39 Row 37
October 18, 2023
Bands 6,5,4
This Landsat 8 image shows the Salton Sea and surrounding area in California.
Landsat 8
Path 39 Row 37
October 18, 2023
Bands 6,5,4
Landsat Collections
Landsat Collections: Providing a Stable Environmental Record for Time Series Analysis
Landsat Collections: Providing a Stable Environmental Record for Time Series Analysis
Landsat Analysis Ready Data (ARD)
The U.S. Geological Survey (USGS) has improved Landsat data quality and usability through the creation of Analysis Ready Data (ARD) for the conterminous United States, Alaska, and Hawaii. Landsat ARD greatly reduces the preparatory work currently required to do time-series analysis for understanding landscape change for operational and science users.
The U.S. Geological Survey (USGS) has improved Landsat data quality and usability through the creation of Analysis Ready Data (ARD) for the conterminous United States, Alaska, and Hawaii. Landsat ARD greatly reduces the preparatory work currently required to do time-series analysis for understanding landscape change for operational and science users.
Landsat Collections — What are Tiers?
This is the third video in a series describing the new U.S. Geological Survey (USGS) Landsat Collection 1 inventory structure. Collection 1 required the reprocessing of all archived Landsat data to achieve radiometric and geometric consistency of Level-1 products through time and across all Landsat sensors.
This is the third video in a series describing the new U.S. Geological Survey (USGS) Landsat Collection 1 inventory structure. Collection 1 required the reprocessing of all archived Landsat data to achieve radiometric and geometric consistency of Level-1 products through time and across all Landsat sensors.
Landsat Collections - RMSE
Landsat Collections: Providing a Stable Environment Record for Time Series Analysis
Landsat Collections: Providing a Stable Environment Record for Time Series Analysis
Example of Landsat Collection 2 Normalized Difference Snow Index
This graphic shows an example of the Landsat Collection 2 Normalized Difference Snow Index (NDSI) in the Boise National Forest, Idaho. Left: Landsat Collection 2 Surface Reflectance; Right: Landsat Collection 2 NDSI
This graphic shows an example of the Landsat Collection 2 Normalized Difference Snow Index (NDSI) in the Boise National Forest, Idaho. Left: Landsat Collection 2 Surface Reflectance; Right: Landsat Collection 2 NDSI
Example of Landsat 8 OLI/TIRS Collection 2 level-2 science products
Example of the Landsat 8 OLI/TIRS Collection 2 level-2 science products. Left: Landsat 8 level-2 surface reflectance image. Right: Landsat 8 level-2 surface temperature image. The data was acquired on May 3, 2013 (path 140 row 41).
Example of the Landsat 8 OLI/TIRS Collection 2 level-2 science products. Left: Landsat 8 level-2 surface reflectance image. Right: Landsat 8 level-2 surface temperature image. The data was acquired on May 3, 2013 (path 140 row 41).
Updated Date: April 29, 2025