West and East eVIIRS Remote Sensing Phenology - SOST for 2023
West and East eVIIRS Remote Sensing Phenology - SOST for 2023Western and Eastern region eVIIRS Remote Sensing Phenology Start of Season for 2023.

Official websites use .gov
A .gov website belongs to an official government organization in the United States.
Secure .gov websites use HTTPS
A lock () or https:// means you’ve safely connected to the .gov website. Share sensitive information only on official, secure websites.
Remote sensing is the process of detecting and monitoring the physical characteristics of an area by measuring its reflected and emitted radiation at a distance (typically from satellite or aircraft). Special cameras collect remotely sensed images, which help researchers "sense" things about the Earth. Some examples are:
Some specific uses of remotely sensed images of the Earth include:

Landsat 8 and Landsat 9 orbit Earth at an altitude of 705 kilometers, or 438 miles. Each satellite captures images across a 185-kilometer, or 115-mile, swath. The satellites move from north to south over the sunlight side of Earth in a sun-synchronous orbit. Each satellite circles Earth every 99 minutes and completes about 14 orbits a day – and passes over the same location once every 16 days...

The sensors onboard each of the Landsat satellites were designed to acquire data in different wavelengths within the electromagnetic spectrum. View Bandpass Wavelengths for all Landsat Sensors The Multispectral Scanner (MSS) carried on Landsat 1,2,3,4 and 5 collected data in four ranges (bands); the Thematic Mapper (TM) sensor on Landsat 4 and Landsat 5 included those bands found on earlier...
Landsat 9 carries the same instruments that are on the Landsat 8 satellite but with some improvements: Operational Land Imager (OLI) for reflective band data. Thermal Infrared Sensor (TIRS) for the thermal infrared bands. OLI has a slightly improved signal-to-noise ratio over Landsat 8's OLI. Landsat 9’s TIRS is a Class-B instrument with a five-year design life and a key improvement of stray light...

Color-infrared (CIR) aerial photography--often called "false color" photography because it renders the scene in colors not normally seen by the human eye--is widely used for interpretation of natural resources. Atmospheric haze does not interfere with the acquisition of the image. Live vegetation is almost always associated with red tones. Very intense reds indicate dense, vigorously growing...

Scans of traditional aerial photography film products (air photos) are not georectified. The USGS does, however, offer several orthoimagery (georectified aerial photograph) products: Digital Orthophoto Quadrangle (DOQ) High Resolution Orthoimagery (HRO) National Agriculture Imagery Program (NAIP, NAIP Plus) NAIP orthoimagery has been collected for the entire conterminous United States every 3...
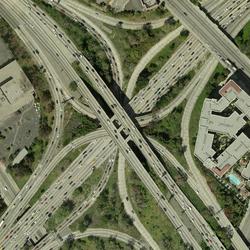
Download orthoimagery (georectified aerial photographs) using EarthExplorer, which has the full catalog of USGS orthoimagery and aerial photography. EarthExplorer: Products Overview Format varies by type of orthoimagery: Native format, Georeferenced Tagged Image File Format (GeoTIFF), or compressed 10:1 JPEG2000 A NAIP orthoimage is included as an optional layer in the PDF format of digital...

Western and Eastern region eVIIRS Remote Sensing Phenology Start of Season for 2023.
Western and Eastern region eVIIRS Remote Sensing Phenology Start of Season for 2023.

Using Military Remote Sensing Technology to Support Federal Civil Agency Science: Sunk Cost, Well Spent
By Paul M. Young, Director of the USGS National Civil Applications Center
Using Military Remote Sensing Technology to Support Federal Civil Agency Science: Sunk Cost, Well Spent
By Paul M. Young, Director of the USGS National Civil Applications Center

Information from satellite imagery helped to differentiate areas vulnerable to soil erosion from off-highway vehicle use. For this study we developed a “P-factor” by scaling ground measurements of soil compaction to vehicle disturbances mapped from aerial imagery.
Information from satellite imagery helped to differentiate areas vulnerable to soil erosion from off-highway vehicle use. For this study we developed a “P-factor” by scaling ground measurements of soil compaction to vehicle disturbances mapped from aerial imagery.

Leaders in the field of remote sensing discuss working with Landsat data since it began in 1972. With the change to a free and open policy 10 years ago, new and exciting possibilities have opened up.
Leaders in the field of remote sensing discuss working with Landsat data since it began in 1972. With the change to a free and open policy 10 years ago, new and exciting possibilities have opened up.

USGS Hydrologist Eric White flies a small drone equipped with a thermal infrared camera during a groundwater/surface-water exchange study.
USGS Hydrologist Eric White flies a small drone equipped with a thermal infrared camera during a groundwater/surface-water exchange study.

Land Remote Sensing Image of Mount St. Helens on May 22, 1983. The volcanic blast on May 18, 1980, devastated more than 150 square miles of forest within a few minutes. In this Landsat false-color images, forest appears as bright red interspersed with patches of logging. Snow appears white, and ash is gray.
Land Remote Sensing Image of Mount St. Helens on May 22, 1983. The volcanic blast on May 18, 1980, devastated more than 150 square miles of forest within a few minutes. In this Landsat false-color images, forest appears as bright red interspersed with patches of logging. Snow appears white, and ash is gray.
Landsat 8 and Landsat 9 orbit Earth at an altitude of 705 kilometers, or 438 miles. Each satellite captures images across a 185-kilometer, or 115-mile, swath. The satellites move from north to south over the sunlight side of Earth in a sun-synchronous orbit. Each satellite circles Earth every 99 minutes and completes about 14 orbits a day – and passes over the same location once every 16 days...
The sensors onboard each of the Landsat satellites were designed to acquire data in different wavelengths within the electromagnetic spectrum. View Bandpass Wavelengths for all Landsat Sensors The Multispectral Scanner (MSS) carried on Landsat 1,2,3,4 and 5 collected data in four ranges (bands); the Thematic Mapper (TM) sensor on Landsat 4 and Landsat 5 included those bands found on earlier...
Landsat 9 carries the same instruments that are on the Landsat 8 satellite but with some improvements: Operational Land Imager (OLI) for reflective band data. Thermal Infrared Sensor (TIRS) for the thermal infrared bands. OLI has a slightly improved signal-to-noise ratio over Landsat 8's OLI. Landsat 9’s TIRS is a Class-B instrument with a five-year design life and a key improvement of stray light...
Color-infrared (CIR) aerial photography--often called "false color" photography because it renders the scene in colors not normally seen by the human eye--is widely used for interpretation of natural resources. Atmospheric haze does not interfere with the acquisition of the image. Live vegetation is almost always associated with red tones. Very intense reds indicate dense, vigorously growing...
Scans of traditional aerial photography film products (air photos) are not georectified. The USGS does, however, offer several orthoimagery (georectified aerial photograph) products: Digital Orthophoto Quadrangle (DOQ) High Resolution Orthoimagery (HRO) National Agriculture Imagery Program (NAIP, NAIP Plus) NAIP orthoimagery has been collected for the entire conterminous United States every 3...
Download orthoimagery (georectified aerial photographs) using EarthExplorer, which has the full catalog of USGS orthoimagery and aerial photography. EarthExplorer: Products Overview Format varies by type of orthoimagery: Native format, Georeferenced Tagged Image File Format (GeoTIFF), or compressed 10:1 JPEG2000 A NAIP orthoimage is included as an optional layer in the PDF format of digital...
Western and Eastern region eVIIRS Remote Sensing Phenology Start of Season for 2023.
Western and Eastern region eVIIRS Remote Sensing Phenology Start of Season for 2023.
Using Military Remote Sensing Technology to Support Federal Civil Agency Science: Sunk Cost, Well Spent
By Paul M. Young, Director of the USGS National Civil Applications Center
Using Military Remote Sensing Technology to Support Federal Civil Agency Science: Sunk Cost, Well Spent
By Paul M. Young, Director of the USGS National Civil Applications Center
Information from satellite imagery helped to differentiate areas vulnerable to soil erosion from off-highway vehicle use. For this study we developed a “P-factor” by scaling ground measurements of soil compaction to vehicle disturbances mapped from aerial imagery.
Information from satellite imagery helped to differentiate areas vulnerable to soil erosion from off-highway vehicle use. For this study we developed a “P-factor” by scaling ground measurements of soil compaction to vehicle disturbances mapped from aerial imagery.
Leaders in the field of remote sensing discuss working with Landsat data since it began in 1972. With the change to a free and open policy 10 years ago, new and exciting possibilities have opened up.
Leaders in the field of remote sensing discuss working with Landsat data since it began in 1972. With the change to a free and open policy 10 years ago, new and exciting possibilities have opened up.
USGS Hydrologist Eric White flies a small drone equipped with a thermal infrared camera during a groundwater/surface-water exchange study.
USGS Hydrologist Eric White flies a small drone equipped with a thermal infrared camera during a groundwater/surface-water exchange study.
Land Remote Sensing Image of Mount St. Helens on May 22, 1983. The volcanic blast on May 18, 1980, devastated more than 150 square miles of forest within a few minutes. In this Landsat false-color images, forest appears as bright red interspersed with patches of logging. Snow appears white, and ash is gray.
Land Remote Sensing Image of Mount St. Helens on May 22, 1983. The volcanic blast on May 18, 1980, devastated more than 150 square miles of forest within a few minutes. In this Landsat false-color images, forest appears as bright red interspersed with patches of logging. Snow appears white, and ash is gray.