
Lick Run concrete lined channel with Mill Mountain in the background
Images
Explore our planet and learn more about our work through photographs and imagery from scientists and support staff.
Filter Total Items: 223

Lick Run concrete lined channel with Mill Mountain in the background
Lick Run concrete lined channel with Mill Mountain in the background

Lick Run concrete lined channel
View of the Lick Run concrete lined channel
View of the Lick Run concrete lined channel
The USGS Franklin pipe extensometer with a total depth of 860 feet.
The USGS Franklin pipe extensometer with a total depth of 860 feet.
Period of record: 1979-1995; 2016-present
The USGS Franklin pipe extensometer with a total depth of 860 feet.
Period of record: 1979-1995; 2016-present

Building housing the USGS Suffolk extensometer
This photograph shows the building housing the USGS Suffolk extensometer. Inside, the extensometer extends to a depth of 1,599 feet below groundlevel.
Period of record: 1982-1995; 2016-present
This photograph shows the building housing the USGS Suffolk extensometer. Inside, the extensometer extends to a depth of 1,599 feet below groundlevel.
Period of record: 1982-1995; 2016-present

The USGS Suffolk pipe extensometer with a total depth of 1,620 feet.
The USGS Suffolk pipe extensometer with a total depth of 1,620 feet.
Period of record: 1982-1995; 2016-present
The USGS Suffolk pipe extensometer with a total depth of 1,620 feet.
Period of record: 1982-1995; 2016-present

Building housing the USGS Franklin extensometer
Building housing the USGS Franklin extensometer. Inside, the extensometer extends 866 feet below land surface.
Period of record: 1979-1995; 2016-present
Building housing the USGS Franklin extensometer. Inside, the extensometer extends 866 feet below land surface.
Period of record: 1979-1995; 2016-present

Learning water quality methods: calibrating a water quality sodne
Learning water quality methods: Sequoya Bua-Iam (2015) calibrates a sonde in the USGS laboratory.
Learning water quality methods: Sequoya Bua-Iam (2015) calibrates a sonde in the USGS laboratory.

Learning water quality methods: recording a water quality sonde
Learning water quality methods: Sequoya Bua-Iam (2015) records a sonde in the USGS laboratory.
Learning water quality methods: Sequoya Bua-Iam (2015) records a sonde in the USGS laboratory.

Trail Near Blue Ridge Parkway Near Afton, Virginia
Trail Near Blue Ridge Parkway Near Afton, Virginia
Trail Near Blue Ridge Parkway Near Afton, Virginia

Water quality sonde at Ramsgate monitoring site in Hampton Roads, Virginia
A water quality monitoring sonde installed at the Conveyance Channel at Ramsgate Lane near Great Bridge, VA. Part of the Hampton Roads Regional Water Quality Monitoring Program.
A water quality monitoring sonde installed at the Conveyance Channel at Ramsgate Lane near Great Bridge, VA. Part of the Hampton Roads Regional Water Quality Monitoring Program.

Conveyance Chain at Ramsgate, Hampton Roads
This stormwater monitoring site is a part of the Hampton Roads Regional Water Quality Monitoring Program.
This stormwater monitoring site is a part of the Hampton Roads Regional Water Quality Monitoring Program.

Ludlow Drive Drainage Creek in Hampton Roads, Virginia
View from the Storm Drain at Ludlow Drive near Kempsville, VA.

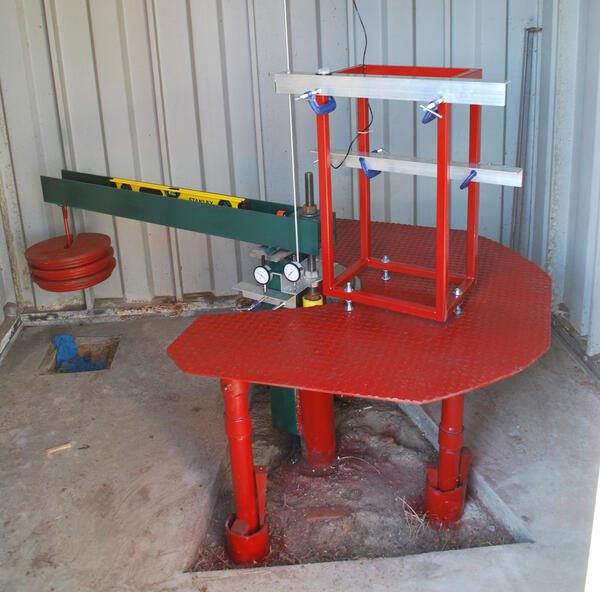
Franklin Extensometer After Aquifer Rebound
Photo of the Franklin extensometer from 2015, after it sustained damage due to aquifer recovery.
Photo of the Franklin extensometer from 2015, after it sustained damage due to aquifer recovery.

2015 Franklin Extensometer Aquifer Rebound Damage
Photo of the original Franklin extensometer taken during an inspection in 2015. Recording had ended in 1995, and between 1995 and 2015, groundwater pumping rates lessened causing the aquifer to briefly recover and the land to rebound. This rebound was so significant that it caused the damage to the extensometer seen above.
Photo of the original Franklin extensometer taken during an inspection in 2015. Recording had ended in 1995, and between 1995 and 2015, groundwater pumping rates lessened causing the aquifer to briefly recover and the land to rebound. This rebound was so significant that it caused the damage to the extensometer seen above.

USGS Scientists Inspect A Research Site in Franklin, Virginia
USGS Scientists inspect the Franklin Extensometer research site in 2015. The extensometer at Franklin had been measuring land subsidence since 1979 but had been offline since 1995 and would be brought back online the following year.
USGS Scientists inspect the Franklin Extensometer research site in 2015. The extensometer at Franklin had been measuring land subsidence since 1979 but had been offline since 1995 and would be brought back online the following year.

Franklin Extensometer Pipe Damage
These four photos show the damage to the decommissioned Franklin extensometer discovered in 2015 before the extensometer was recommissioned. Damage was caused by a reduction in groundwater pumping leading to land surface uplift.
These four photos show the damage to the decommissioned Franklin extensometer discovered in 2015 before the extensometer was recommissioned. Damage was caused by a reduction in groundwater pumping leading to land surface uplift.

Aquariums Inside a Mobile Fish Exposure Laboratory
Scientists deployed mobile fish exposure laboratories at sites in the Shenandoah River watershed, Virginia, to understand exposure and effects on fish. This photo shows the aquariums in a laboratory where fish were exposed to stream water or wastewater.
Scientists deployed mobile fish exposure laboratories at sites in the Shenandoah River watershed, Virginia, to understand exposure and effects on fish. This photo shows the aquariums in a laboratory where fish were exposed to stream water or wastewater.

James River Tidal Survey
james River Tidal Survey
james River Tidal Survey

Learning water quality methods: collecting a water quality sample
Learning water quality methods: Aaron Bartlett (2014) collecting a water quality sample at Fine Creek.
Learning water quality methods: Aaron Bartlett (2014) collecting a water quality sample at Fine Creek.

Water Quality at Fairfax
Water quality monitoring in Fairfax county
Water quality monitoring in Fairfax county

Fairfax Water Quality Monitoring
A photo of a water quality monitoring site located in Fairfax county, Virginia.
Learn more about water quality monitoring in Fairfax county.
A photo of a water quality monitoring site located in Fairfax county, Virginia.
Learn more about water quality monitoring in Fairfax county.