
Preliminary lidar data collected in the John Heinz Wildlife Refuge as a baseline for future topography change.
Images
Woods Hole Coastal and Marine Science Center images
Filter Total Items: 1090

sUAS at Darby Creek Superfund Site
Preliminary lidar data collected in the John Heinz Wildlife Refuge as a baseline for future topography change.

sUAS at Darby Creek Superfund Site
USGS sUAS pilots with Josh Barber from the EPA and a sUAS with the lidar payload mounted and ready to fly over the John Heinz Wildlife Refuge.
USGS sUAS pilots with Josh Barber from the EPA and a sUAS with the lidar payload mounted and ready to fly over the John Heinz Wildlife Refuge.

Hurricane Lee buoy deployment
The USGS and partners prepare to deploy 11 buoys into the Gulf of Maine from a U.S. Navy aircraft in preparation for Hurricane Lee. These buoys measure waves, temperature, and physical ocean properties.
The USGS and partners prepare to deploy 11 buoys into the Gulf of Maine from a U.S. Navy aircraft in preparation for Hurricane Lee. These buoys measure waves, temperature, and physical ocean properties.

sUAS at Darby Creek Superfund Site
Fish and Wildlife personnel participating in a demonstration by the WHCMSC about using sUAS to collect remotely sensed data.
Fish and Wildlife personnel participating in a demonstration by the WHCMSC about using sUAS to collect remotely sensed data.

sUAS at Darby Creek Superfund Site
A preliminary elevation model created by flying sUAS with a lidar scanner over the ClearView landfill.
A preliminary elevation model created by flying sUAS with a lidar scanner over the ClearView landfill.

sUAS at Darby Creek Superfund Site
ish and Wildlife personnel participating in a demonstration by the WHCMSC about using sUAS to collect remotely sensed data.
ish and Wildlife personnel participating in a demonstration by the WHCMSC about using sUAS to collect remotely sensed data.

sUAS at Darby Creek Superfund Site
Jin-Si Over (WHCMSC) and Chris Gazoorian (NYWSC) preparing to fly the YellowScan Mapper+ to collect lidar data on the ClearView Landfill.
Jin-Si Over (WHCMSC) and Chris Gazoorian (NYWSC) preparing to fly the YellowScan Mapper+ to collect lidar data on the ClearView Landfill.
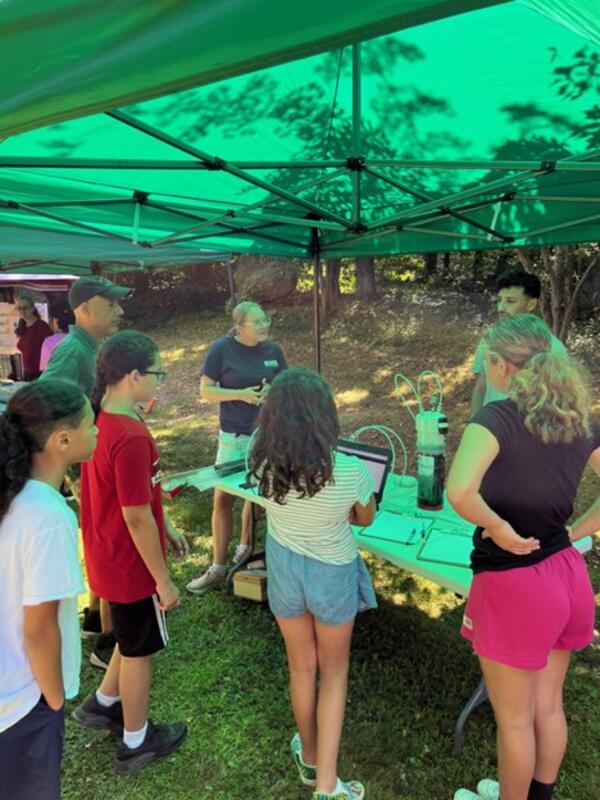
Mashpee Wampanoag Tribe Preserving Our Homeland summer science camp
USGS scientists participated in the Mashpee Wampanoag Tribe Preserving Our Homeland summer science camp in 2023.
USGS scientists participated in the Mashpee Wampanoag Tribe Preserving Our Homeland summer science camp in 2023.

Mashpee Wampanoag Tribe Preserving Our Homeland summer science camp
USGS scientists participated in the Mashpee Wampanoag Tribe Preserving Our Homeland summer science camp in 2023.
USGS scientists participated in the Mashpee Wampanoag Tribe Preserving Our Homeland summer science camp in 2023.

Mashpee Wampanoag Tribe Preserving Our Homeland summer science camp
USGS scientists participated in the Mashpee Wampanoag Tribe Preserving Our Homeland summer science camp in 2023.
USGS scientists participated in the Mashpee Wampanoag Tribe Preserving Our Homeland summer science camp in 2023.

Collecting pre-restoration LiDAR and thermal survey data
In July and October, Jen Cramer and Jin-Si Over assisted USGS UAS pilots from NUSO and Fort Collins to collect pre-restoration LiDAR and thermal survey data for the Vermillion River on the Kootenai National Forest in Montana before construction begins to improve Bull Trout habitat.
In July and October, Jen Cramer and Jin-Si Over assisted USGS UAS pilots from NUSO and Fort Collins to collect pre-restoration LiDAR and thermal survey data for the Vermillion River on the Kootenai National Forest in Montana before construction begins to improve Bull Trout habitat.

UAS demonstration in Woods Hole, Massachusetts
A UAS demonstration in Woods Hole, Massachusetts with WH-Coastal and Marine Science Center personnel and NE Region administration.
Summer 2023 NER Photo Contest Winner: Jin-Si Over, People category
A UAS demonstration in Woods Hole, Massachusetts with WH-Coastal and Marine Science Center personnel and NE Region administration.
Summer 2023 NER Photo Contest Winner: Jin-Si Over, People category

Coastal Science Navigator - CCH Portal
The Coastal Change Hazards Portal product summary page within the Coastal Science Navigator. The Coastal Science Navigator serves as a gateway to USGS Coastal Change Hazards resources and assists users in finding products and tools that will meet their specific needs.
The Coastal Change Hazards Portal product summary page within the Coastal Science Navigator. The Coastal Science Navigator serves as a gateway to USGS Coastal Change Hazards resources and assists users in finding products and tools that will meet their specific needs.

Coastal Science Navigator - CCH Portal
The bottom portion of the Coastal Change Hazards Portal product summary page within the Coastal Science Navigator. The Coastal Science Navigator serves as a gateway to USGS Coastal Change Hazards resources and assists users in finding products and tools that will meet their specific needs.
The bottom portion of the Coastal Change Hazards Portal product summary page within the Coastal Science Navigator. The Coastal Science Navigator serves as a gateway to USGS Coastal Change Hazards resources and assists users in finding products and tools that will meet their specific needs.

Coastal Science Navigator - Filter Search
The Filter Search page within the Coastal Science Navigator. The Coastal Science Navigator serves as a gateway to USGS Coastal Change Hazards resources and assists users in finding products and tools that will meet their specific needs. The Filter Search allows users to see all available products and apply filters to narrow the adjacent list to relevant to
The Filter Search page within the Coastal Science Navigator. The Coastal Science Navigator serves as a gateway to USGS Coastal Change Hazards resources and assists users in finding products and tools that will meet their specific needs. The Filter Search allows users to see all available products and apply filters to narrow the adjacent list to relevant to

Coastal Science Navigator - Guided Search
The Guided Search page within the Coastal Science Navigator. The Coastal Science Navigator serves as a gateway to USGS Coastal Change Hazards resources and assists users in finding products and tools that will meet their specific needs.
The Guided Search page within the Coastal Science Navigator. The Coastal Science Navigator serves as a gateway to USGS Coastal Change Hazards resources and assists users in finding products and tools that will meet their specific needs.

USGS Coastal Science Navigator
The USGS Coastal Science Navigator serves as a gateway to USGS Coastal Change Hazards resources and assists users in finding products and tools that will meet their specific needs.
The USGS Coastal Science Navigator serves as a gateway to USGS Coastal Change Hazards resources and assists users in finding products and tools that will meet their specific needs.

Surface elevation table measurements on a degraded marsh in Jamaica Bay, New York
Jim Lynch (NPS) measuring marsh elevation change using a Surface Elevation Table (SET) near West Pond, Jamaica Bay, New York. Lateral erosion can reduce overall marsh area while elevation of the marsh at a point may be keeping pace with sea-level rise.
Jim Lynch (NPS) measuring marsh elevation change using a Surface Elevation Table (SET) near West Pond, Jamaica Bay, New York. Lateral erosion can reduce overall marsh area while elevation of the marsh at a point may be keeping pace with sea-level rise.

Conducting multichannel seismic operations at the main lab of the Research Vessel Marcus G. Langseth
linkMain lab of the Research Vessel Marcus G. Langseth (Columbia University - Lamont-Doherty Earth Observatory) while underway conducting multichannel seismic operations.
Spring 2023 Photo Contest Winner: Wayne Baldwin, Honorable Mention category

Coastal Change Likelihood Geonarrative
The Coastal Change Likelihood (CCL) assessment combines over twenty coastal data sources that describe the landscape and the hazards that act on it to determine the future likelihood of change on the coast in the next decade.
The Coastal Change Likelihood (CCL) assessment combines over twenty coastal data sources that describe the landscape and the hazards that act on it to determine the future likelihood of change on the coast in the next decade.

USGS at Coastal Sediments 2023
The USGS was proud to be an exhibitor and sponsor at the Coastal Sediments Conference in New Orleans, Louisiana, in April 2023.
The USGS was proud to be an exhibitor and sponsor at the Coastal Sediments Conference in New Orleans, Louisiana, in April 2023.