
Lidar point cloud image of USGS headquarters building in Reston, VA, shaded by elevation
Images
Images intro.
Filter Total Items: 567

Lidar Point Cloud USGS Headquarters Reston Elevation Symbology
Lidar point cloud image of USGS headquarters building in Reston, VA, shaded by elevation

Earth MRI - Western Alaska Range
Earth MRI - Western Alaska Range
Earth MRI - Western Alaska Range

Transportation layer from a 3/7/19 US Topo map
Selected area from a 3/7/19 US Topo map depicting the transportation features (roads, railroads) in the selection.
Selected area from a 3/7/19 US Topo map depicting the transportation features (roads, railroads) in the selection.

Image Depicting Transportation-Structures-Orthoimagery on 2019 US Topo
Image depicting transportation layer (left image) and structures / orthoimage layers (right image) from a selected area of a 2019 US Topo map of Dallas, TX.
Image depicting transportation layer (left image) and structures / orthoimage layers (right image) from a selected area of a 2019 US Topo map of Dallas, TX.

Dark Hollow Falls
Dark Hollow Falls - Shenandoah National Park, VA
Dark Hollow Falls - Shenandoah National Park, VA

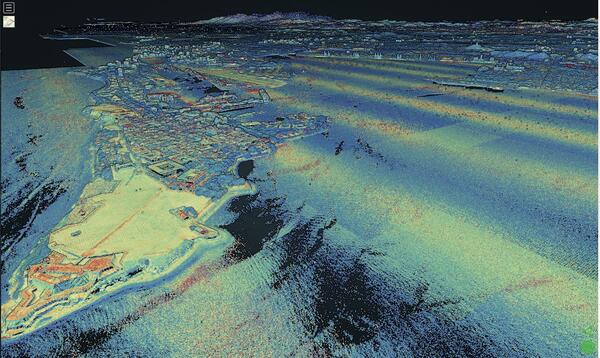
3DEP, Lidar point cloud, Pre-Hurricane Maria
Figure 2: Zooming in to red rectangle A from figure 1. Points colored by laser intensity (blue = low intensity, red = high intensity).
Figure 2: Zooming in to red rectangle A from figure 1. Points colored by laser intensity (blue = low intensity, red = high intensity).
Lidar point cloud, Pre-Hurricane PR, rotate and zoom
Figure 3: Zooming in and rotating scene in 3D from figure 2. Points coloer by laser intensity (blue = low intensity, red = high intensity).
Figure 3: Zooming in and rotating scene in 3D from figure 2. Points coloer by laser intensity (blue = low intensity, red = high intensity).

San Carlos Apache Reservation Drought Research
(A) The Creek Fire perimeter within the San Carlos Apache Reservation in east-central Arizona and (B) the various fuel treatments within the Creek Fire boundary, using the boundary in Wu et al.
(A) The Creek Fire perimeter within the San Carlos Apache Reservation in east-central Arizona and (B) the various fuel treatments within the Creek Fire boundary, using the boundary in Wu et al.

New Jersey Landsat State Mosaic
Modern paleontology began with the 1858 discovery by William Parker Foulke at Haddonfield, New Jersey of the nearly complete skeleton of a dinosaur called Hadrosaurus.
Capital Trenton
Image Source Landsat 8
Population 9,288,994
Modern paleontology began with the 1858 discovery by William Parker Foulke at Haddonfield, New Jersey of the nearly complete skeleton of a dinosaur called Hadrosaurus.
Capital Trenton
Image Source Landsat 8
Population 9,288,994

Ohio Landsat State Mosaic
Did you know that nearly 50 percent of the United States population lives within a 500-mile radius of Columbus, Ohio? Columbus is the state capital and Ohio’s largest city. It is also home to The Ohio State University.
Capital Columbus
Image Source Landsat 8
Did you know that nearly 50 percent of the United States population lives within a 500-mile radius of Columbus, Ohio? Columbus is the state capital and Ohio’s largest city. It is also home to The Ohio State University.
Capital Columbus
Image Source Landsat 8

Texas Landsat State Mosaid
Six flags have flown over Texas: Spain, France, United Mexican States, Confederate States of America, the Republic of Texas, and the United States of America, with eight changes of government.
Capital Austin
Image Source Landsat 8
Population 29,145,505
Six flags have flown over Texas: Spain, France, United Mexican States, Confederate States of America, the Republic of Texas, and the United States of America, with eight changes of government.
Capital Austin
Image Source Landsat 8
Population 29,145,505

Map of AK showing probability of change occurrence
Map of Alaska showing probability (%) of change occurrence. Insets show fire boundaries from the Bureau of Land Management (BLM) Large Fire Database and Landsat 8 imagery (bottom right; 2016) north of Fairbanks, Alaska.
Map of Alaska showing probability (%) of change occurrence. Insets show fire boundaries from the Bureau of Land Management (BLM) Large Fire Database and Landsat 8 imagery (bottom right; 2016) north of Fairbanks, Alaska.
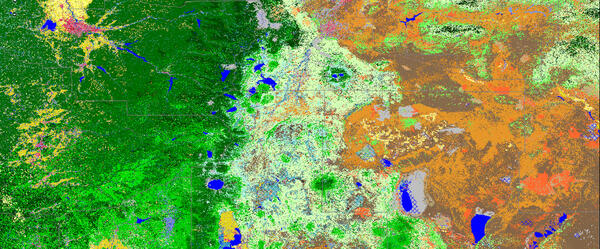
LANDFIRE- Landscape Fire and Resource Management Planning Tools
LANDFIRE Existing Vegetation Type imagery.
LANDFIRE Existing Vegetation Type imagery.

Mt. Kīlauea - July 2018
This image shows a lidar flight done in July 2018 of the Kīlauea volcano after the collapse of the caldera
This image shows a lidar flight done in July 2018 of the Kīlauea volcano after the collapse of the caldera


Survey Analysis via Visual Exploration rock cores
Survey Analysis via Visual Exploration rock cores
Survey Analysis via Visual Exploration rock cores

Kevin T. Gallagher at MAPPS Executive Summit on US lidar coverage
Kevin T. Gallagher, USGS Associate Director, Core Science Systems, addresses
Members of the MAPPS Executive Summit on US lidar coverage
Kevin T. Gallagher, USGS Associate Director, Core Science Systems, addresses
Members of the MAPPS Executive Summit on US lidar coverage

Natural oil seep along Tarwater Creek, San Mateo County, California
The natural oil seep in this photo is located in Pescadero Creek County Park, where the Canyon Trail crosses Tarwater Creek. The oil is black, has a taffy-like consistency, and smells like motor oil.
The natural oil seep in this photo is located in Pescadero Creek County Park, where the Canyon Trail crosses Tarwater Creek. The oil is black, has a taffy-like consistency, and smells like motor oil.

Simulated flooding, Denver, CO
A 3D Elevation Program lidar point cloud colored by RGB color from imagery from the National Agriculture Imagery Program and showing simulated flooding (in blue) of an area in Denver, Colorado.
A 3D Elevation Program lidar point cloud colored by RGB color from imagery from the National Agriculture Imagery Program and showing simulated flooding (in blue) of an area in Denver, Colorado.

Oil well pumping unit, Half Moon Bay oil field, California
The Half Moon Bay oil field is one of the oldest oil fields in California and was first developed during the 1880s. Since then, the field has produced an estimated 60,000 barrels of oil from about 19 wells.
The Half Moon Bay oil field is one of the oldest oil fields in California and was first developed during the 1880s. Since then, the field has produced an estimated 60,000 barrels of oil from about 19 wells.