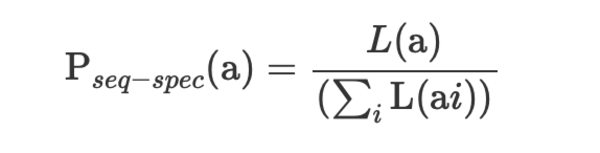
Aftershock Forecast Sequence-Specific Model Parameters equation
The probability distribution for the number of aftershocks, P(N), and the forecast can then be computed using the same procedures as for the generic model, using Pseq-spec(a) instead of Pgeneric(a).


")

")