
The new Hydrologic Instrumentation Facility (HIF) on the University of Alabama Campus at Tuscaloosa, AL. The new facility is a national USGS capability that includes:
Images
Explore water-related photography, imagery, and illustrations.
Filter Total Items: 2414

Hydrologic Instrumentation Facility (Tuscaloosa, Alabama)
The new Hydrologic Instrumentation Facility (HIF) on the University of Alabama Campus at Tuscaloosa, AL. The new facility is a national USGS capability that includes:

USGS Scientists Deploy to New Mexico Fire to Enhance Water Monitoring
USGS Water and Fire Technicians team members, Jorge Gonzalez and Efren Alvarado, made repairs to the Buck Mountain precipitation gage during the Blue 2 Fire near Alto, New Mexico on June 7, 2024. This station, along with similar gages, provides critical real-time rainfall data to the National Weather Service and local emergency managers.
USGS Water and Fire Technicians team members, Jorge Gonzalez and Efren Alvarado, made repairs to the Buck Mountain precipitation gage during the Blue 2 Fire near Alto, New Mexico on June 7, 2024. This station, along with similar gages, provides critical real-time rainfall data to the National Weather Service and local emergency managers.
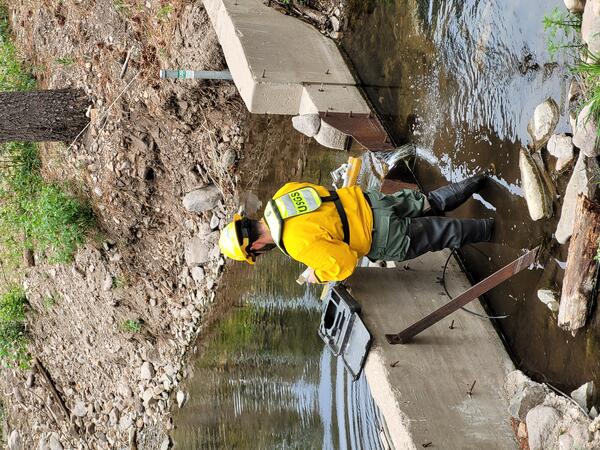
Repairing a streamgage during the Blue 2 Fire near Alto, New Mexico
A member of the USGS Water and Fire Technicians Team repairs a streamgage during the Blue 2 Fire near Alto, New Mexico.
A member of the USGS Water and Fire Technicians Team repairs a streamgage during the Blue 2 Fire near Alto, New Mexico.

The USGS Water and Fire Technicians Team prepares to evaluate precipitation and streamflow gauges during the Blue 2 Fire near Alto, New Mexico.
linkThe USGS Water and Fire Technicians Team prepares to evaluate precipitation and streamflow gauges during the Blue 2 Fire near Alto, New Mexico.
The USGS Water and Fire Technicians Team prepares to evaluate precipitation and streamflow gauges during the Blue 2 Fire near Alto, New Mexico.
linkThe USGS Water and Fire Technicians Team prepares to evaluate precipitation and streamflow gauges during the Blue 2 Fire near Alto, New Mexico.

4_15_IGpost_NYCbedrock_Drupal.png
Image shows a screenshot of the New York City Bedrock and Groundwater Mapper.
Image shows a screenshot of the New York City Bedrock and Groundwater Mapper.

Water Use Diagram
Diagram of the process of water use from source (surface water, groundwater, reuse water) through transmission, utility reservoir, water treatment, distribution, and withdrawal for industry, residential, and commercial.
Diagram of the process of water use from source (surface water, groundwater, reuse water) through transmission, utility reservoir, water treatment, distribution, and withdrawal for industry, residential, and commercial.

Gage Greatness 2024 Bracket Finale Tie
The final bracket for Gage Greatness 2024 announcing the winners:
The final bracket for Gage Greatness 2024 announcing the winners:

Gage Greatness 2024 Finals bracket image
The bracket for the Finals! New Jersey's and Colorado's gages will compete to see whose gage is the greatest for Gage Greatest 2024.
The bracket for the Finals! New Jersey's and Colorado's gages will compete to see whose gage is the greatest for Gage Greatest 2024.

Hypothetical Riverine Floodplain Diagram (with caption)
A cross-sectional view of a hypothetical river showing one possible arrangement of the three Federal Flood Risk Management Standard (FFRMS) floodplain elevations (Climate-Informed Science Approach, the Freeboard Value Approach, and the 0.2% Annual-Chance Flood Approach) above the current Base Flood Elevation, i.e., the 1% annual-chance flood elevation.
A cross-sectional view of a hypothetical river showing one possible arrangement of the three Federal Flood Risk Management Standard (FFRMS) floodplain elevations (Climate-Informed Science Approach, the Freeboard Value Approach, and the 0.2% Annual-Chance Flood Approach) above the current Base Flood Elevation, i.e., the 1% annual-chance flood elevation.

Hypothetical Riverine Floodplain Diagram
A cross-sectional view of a hypothetical river showing one possible arrangement of the three Federal Flood Risk Management Standard (FFRMS) floodplain elevations (Climate-Informed Science Approach, the Freeboard Value Approach, and the 0.2% Annual-Chance Flood Approach) above the current Base Flood Elevation, i.e., the 1% annual-chance flood elevation.
A cross-sectional view of a hypothetical river showing one possible arrangement of the three Federal Flood Risk Management Standard (FFRMS) floodplain elevations (Climate-Informed Science Approach, the Freeboard Value Approach, and the 0.2% Annual-Chance Flood Approach) above the current Base Flood Elevation, i.e., the 1% annual-chance flood elevation.

Hypothetical Coastal Floodplain Diagram
A cross-sectional view of a hypothetical coastline showing one possible arrangement of the three Federal Flood Risk Management Standard (FFRMS) floodplain elevations (Climate-Informed Science Approach, the Freeboard Value Approach, and the 0.2% Annual-Chance Flood Approach) above the current Base Flood Elevation, i.e., the 1% annual-chance flood elevation.
A cross-sectional view of a hypothetical coastline showing one possible arrangement of the three Federal Flood Risk Management Standard (FFRMS) floodplain elevations (Climate-Informed Science Approach, the Freeboard Value Approach, and the 0.2% Annual-Chance Flood Approach) above the current Base Flood Elevation, i.e., the 1% annual-chance flood elevation.

Hypothetical Coastal Floodplain Diagram (with caption)
A cross-sectional view of a hypothetical coastline showing one possible arrangement of the three Federal Flood Risk Management Standard (FFRMS) floodplain elevations (Climate-Informed Science Approach, the Freeboard Value Approach, and the 0.2% Annual-Chance Flood Approach) above the current Base Flood Elevation, i.e., the 1% annual-chance flood elevation.
A cross-sectional view of a hypothetical coastline showing one possible arrangement of the three Federal Flood Risk Management Standard (FFRMS) floodplain elevations (Climate-Informed Science Approach, the Freeboard Value Approach, and the 0.2% Annual-Chance Flood Approach) above the current Base Flood Elevation, i.e., the 1% annual-chance flood elevation.

Mid-Section ADCP Class in Asheville, NC.
Photograph showing USGS staff learning how to collect Mid-Section ADCP data from a bridge in Asheville, North Carolina.
Photograph showing USGS staff learning how to collect Mid-Section ADCP data from a bridge in Asheville, North Carolina.

USGS scientist retrieves water quality sensor on the Rio Grande in Albuquerque, New Mexico
USGS scientist Kimberly Beisner retrieves a water quality sensor on the Rio Grande for a PFAS study in Albuquerque, New Mexico.
USGS scientist Kimberly Beisner retrieves a water quality sensor on the Rio Grande for a PFAS study in Albuquerque, New Mexico.

USGS scientists walk into the Rio Grande to collect water samples for a PFAS study near Valle de Oro, New Mexico.
linkUSGS scientists Kimberly Beisner and Keely Miltenberger walk into the Rio Grande to collect water samples for a PFAS study near Valle de Oro, New Mexico.
USGS scientists walk into the Rio Grande to collect water samples for a PFAS study near Valle de Oro, New Mexico.
linkUSGS scientists Kimberly Beisner and Keely Miltenberger walk into the Rio Grande to collect water samples for a PFAS study near Valle de Oro, New Mexico.

Water quality sampler deployed on the Rio Grande in Alameda, New Mexico.
Water quality sampler deployed on the Rio Grande to collect an integrated sample of PFAS in the water in Alameda, New Mexico.
Water quality sampler deployed on the Rio Grande to collect an integrated sample of PFAS in the water in Alameda, New Mexico.

StreamStats Batch Processing Tool Screenshot
Screenshot of the StreamStats Batch Processing Tool user interface. This tool produces shapefiles that contain the delineated basins, basin characteristics, and flow statistics for multiple sites requested at once by users.
Screenshot of the StreamStats Batch Processing Tool user interface. This tool produces shapefiles that contain the delineated basins, basin characteristics, and flow statistics for multiple sites requested at once by users.

Salt deposits along the Paria River, UT
Salt deposits along the Paria River, UT. USGS scientists are studying salinity in the Upper Colorado Basin.
Salt deposits along the Paria River, UT. USGS scientists are studying salinity in the Upper Colorado Basin.

Dolores River, CO
The Dolores River, CO, a tributary of the Colorado River. USGS scientists are studying salinity in the Upper Colorado Basin.
The Dolores River, CO, a tributary of the Colorado River. USGS scientists are studying salinity in the Upper Colorado Basin.

Tarah Balden, scientist, Yurok Tribe looking at data logger
A soil moisture data logger buried in the ground is a specialized instrument designed to measure and record the moisture content of soil over time. Here's how it generally functions:
A soil moisture data logger buried in the ground is a specialized instrument designed to measure and record the moisture content of soil over time. Here's how it generally functions:

HIVIS camera along the San Antonio River
A Hydrologic Imagery Visualization and Information System (HIVIS) camera along the San Antonio River in San Antonio, Texas. The camera is used to verify the position of a gate that is operated by the City of San Antonio. Check out the camera here.
A Hydrologic Imagery Visualization and Information System (HIVIS) camera along the San Antonio River in San Antonio, Texas. The camera is used to verify the position of a gate that is operated by the City of San Antonio. Check out the camera here.