
The new Hydrologic Instrumentation Facility (HIF) on the University of Alabama Campus at Tuscaloosa, AL. The new facility is a national USGS capability that includes:
Multimedia
This multimedia gallery represents a collection of high-quality images, videos, webcams, posters, presentations, and documents produced by the Water Resources Mission Area.
Images

Hydrologic Instrumentation Facility (Tuscaloosa, Alabama)
The new Hydrologic Instrumentation Facility (HIF) on the University of Alabama Campus at Tuscaloosa, AL. The new facility is a national USGS capability that includes:

USGS Scientists Deploy to New Mexico Fire to Enhance Water Monitoring
USGS Water and Fire Technicians team members, Jorge Gonzalez and Efren Alvarado, made repairs to the Buck Mountain precipitation gage during the Blue 2 Fire near Alto, New Mexico on June 7, 2024. This station, along with similar gages, provides critical real-time rainfall data to the National Weather Service and local emergency managers.
USGS Water and Fire Technicians team members, Jorge Gonzalez and Efren Alvarado, made repairs to the Buck Mountain precipitation gage during the Blue 2 Fire near Alto, New Mexico on June 7, 2024. This station, along with similar gages, provides critical real-time rainfall data to the National Weather Service and local emergency managers.
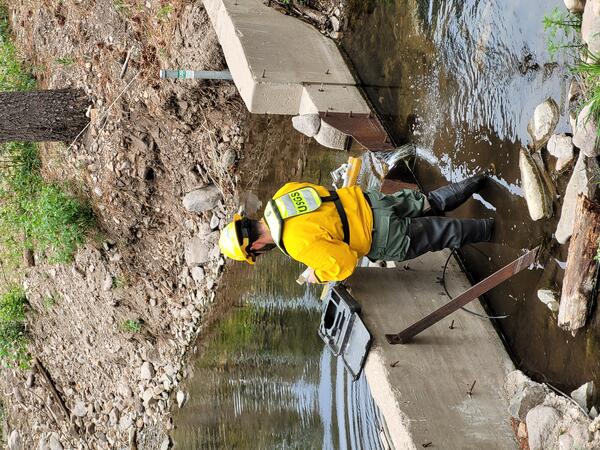
Repairing a streamgage during the Blue 2 Fire near Alto, New Mexico
A member of the USGS Water and Fire Technicians Team repairs a streamgage during the Blue 2 Fire near Alto, New Mexico.
A member of the USGS Water and Fire Technicians Team repairs a streamgage during the Blue 2 Fire near Alto, New Mexico.

The USGS Water and Fire Technicians Team prepares to evaluate precipitation and streamflow gauges during the Blue 2 Fire near Alto, New Mexico.
linkThe USGS Water and Fire Technicians Team prepares to evaluate precipitation and streamflow gauges during the Blue 2 Fire near Alto, New Mexico.
The USGS Water and Fire Technicians Team prepares to evaluate precipitation and streamflow gauges during the Blue 2 Fire near Alto, New Mexico.
linkThe USGS Water and Fire Technicians Team prepares to evaluate precipitation and streamflow gauges during the Blue 2 Fire near Alto, New Mexico.

4_15_IGpost_NYCbedrock_Drupal.png
Image shows a screenshot of the New York City Bedrock and Groundwater Mapper.
Image shows a screenshot of the New York City Bedrock and Groundwater Mapper.

Water Use Diagram
Diagram of the process of water use from source (surface water, groundwater, reuse water) through transmission, utility reservoir, water treatment, distribution, and withdrawal for industry, residential, and commercial.
Diagram of the process of water use from source (surface water, groundwater, reuse water) through transmission, utility reservoir, water treatment, distribution, and withdrawal for industry, residential, and commercial.
Videos

U.S. River Conditions, April to June 2024
This is an animation showing the changing conditions relative to the historic record of USGS streamgages from April 1, 2024 to June 30, 2024. The river conditions shown range from the driest condition seen at a gage (red open circles) to the wettest (blue closed circles). A purple outer ring around a gage indicates it is flooding.
This is an animation showing the changing conditions relative to the historic record of USGS streamgages from April 1, 2024 to June 30, 2024. The river conditions shown range from the driest condition seen at a gage (red open circles) to the wettest (blue closed circles). A purple outer ring around a gage indicates it is flooding.

Hydrologic Instrumentation Research and Operations Chief Recruitment Information Session
We’re hiring!

U.S. River Conditions, January to March 2024
This is an animation showing the changing conditions relative to the historic record of USGS streamgages from January 1, 2024 to March 31, 2024. The river conditions shown range from the driest condition seen at a gage (red open circles) to the wettest (blue closed circles). A purple outer ring around a gage indicates it is flooding.
This is an animation showing the changing conditions relative to the historic record of USGS streamgages from January 1, 2024 to March 31, 2024. The river conditions shown range from the driest condition seen at a gage (red open circles) to the wettest (blue closed circles). A purple outer ring around a gage indicates it is flooding.

Accessing Samples and Water Quality 4/11/24 Webinar
The Water Data for the Nation (WDFN) team updated the public and other stakeholders on changes to USGS water quality and samples data access. Legacy access to water-quality and samples data are being retired, and new WDFN pages and features will provide access to discrete water quality and sample data.
The Water Data for the Nation (WDFN) team updated the public and other stakeholders on changes to USGS water quality and samples data access. Legacy access to water-quality and samples data are being retired, and new WDFN pages and features will provide access to discrete water quality and sample data.

U.S. River Conditions, October to December 2023
This is an animation showing the changing conditions relative to the historic record of USGS streamgages from October 1, 2023 to December 31, 2023. The river conditions shown range from the driest condition seen at a gage (red open circles) to the wettest (blue closed circles). A purple outer ring around a gage indicates it is flooding.
This is an animation showing the changing conditions relative to the historic record of USGS streamgages from October 1, 2023 to December 31, 2023. The river conditions shown range from the driest condition seen at a gage (red open circles) to the wettest (blue closed circles). A purple outer ring around a gage indicates it is flooding.

Explore the Risk PFAS is in Local Tap Water
U.S. Geological Survey scientists created an interactive map to help the public better understand their risk of exposure to PFAS, also known as “forever chemicals.” This interactive tool allows you to view data from a recently published USGS study on PFAS in tap water as well as learn where known PFAS sources are near your community.
U.S. Geological Survey scientists created an interactive map to help the public better understand their risk of exposure to PFAS, also known as “forever chemicals.” This interactive tool allows you to view data from a recently published USGS study on PFAS in tap water as well as learn where known PFAS sources are near your community.
Audio

Eyes on Earth Episode 43 - U.S.-Canada Water Use
The St. Mary and Milk Rivers cross the U.S. and Canadian border and supply water to both countries. Managing that resource in the interest of both nations is a matter of international collaboration and cooperation, and Landsat data is helping offer objective information on water use.
The St. Mary and Milk Rivers cross the U.S. and Canadian border and supply water to both countries. Managing that resource in the interest of both nations is a matter of international collaboration and cooperation, and Landsat data is helping offer objective information on water use.

Responding to Hurricanes, Floods and Droughts in North Carolina
North Carolina, like many years before, is responding to flooding in the East and drought in the West. Holly Weyers, USGS North Carolina Water Science Center Director, discusses these extreme events.
North Carolina, like many years before, is responding to flooding in the East and drought in the West. Holly Weyers, USGS North Carolina Water Science Center Director, discusses these extreme events.

Groundwater Awareness Week is March 6-12
Groundwater is not a single vast pool of underground water; rather, it is contained within a variety of aquifer systems. Each of these aquifers has its own set of questions and challenges.
Groundwater is not a single vast pool of underground water; rather, it is contained within a variety of aquifer systems. Each of these aquifers has its own set of questions and challenges.
USGS Hydrologic Data Collection Program in North Carolina
USGS North Carolina Data Chief, Jeanne Robbins, provides an overview on hydrologic data collection techniques for North Carolina.
USGS North Carolina Data Chief, Jeanne Robbins, provides an overview on hydrologic data collection techniques for North Carolina.
Marking the Milestone, The Triangle Area Water Supply Monitoring Proj
USGS North Carolina Water Quality Specialist Mary Georgino discusses The Triangle Area Water Supply Monitoring Project.
USGS North Carolina Water Quality Specialist Mary Georgino discusses The Triangle Area Water Supply Monitoring Project.
Hurricane Floyd, and the Floods of 1999
USGS North Carolina Water Science Center Director Jerad Bales discusses Hurricane Floyd and flood impacts on North Carolina in 1999.
USGS North Carolina Water Science Center Director Jerad Bales discusses Hurricane Floyd and flood impacts on North Carolina in 1999.
Webcams
Streamgage 09152500 Gunnison River near Grand Junction, CO
Webcam at USGS Streamgage 09152500 Gunnison River near Grand Junction, CO.
Visit Water Data For the Nation to get current data for this site.
Webcam at USGS Streamgage 09152500 Gunnison River near Grand Junction, CO.
Visit Water Data For the Nation to get current data for this site.
Streamgage 09034250 Colorado River at Windy Gap near Granby, CO
Webcam at USGS Streamgage 09034250 Colorado River at Windy Gap near Granby, CO.
Visit Water Data For the Nation to get current data for this site.
Webcam at USGS Streamgage 09034250 Colorado River at Windy Gap near Granby, CO.
Visit Water Data For the Nation to get current data for this site.
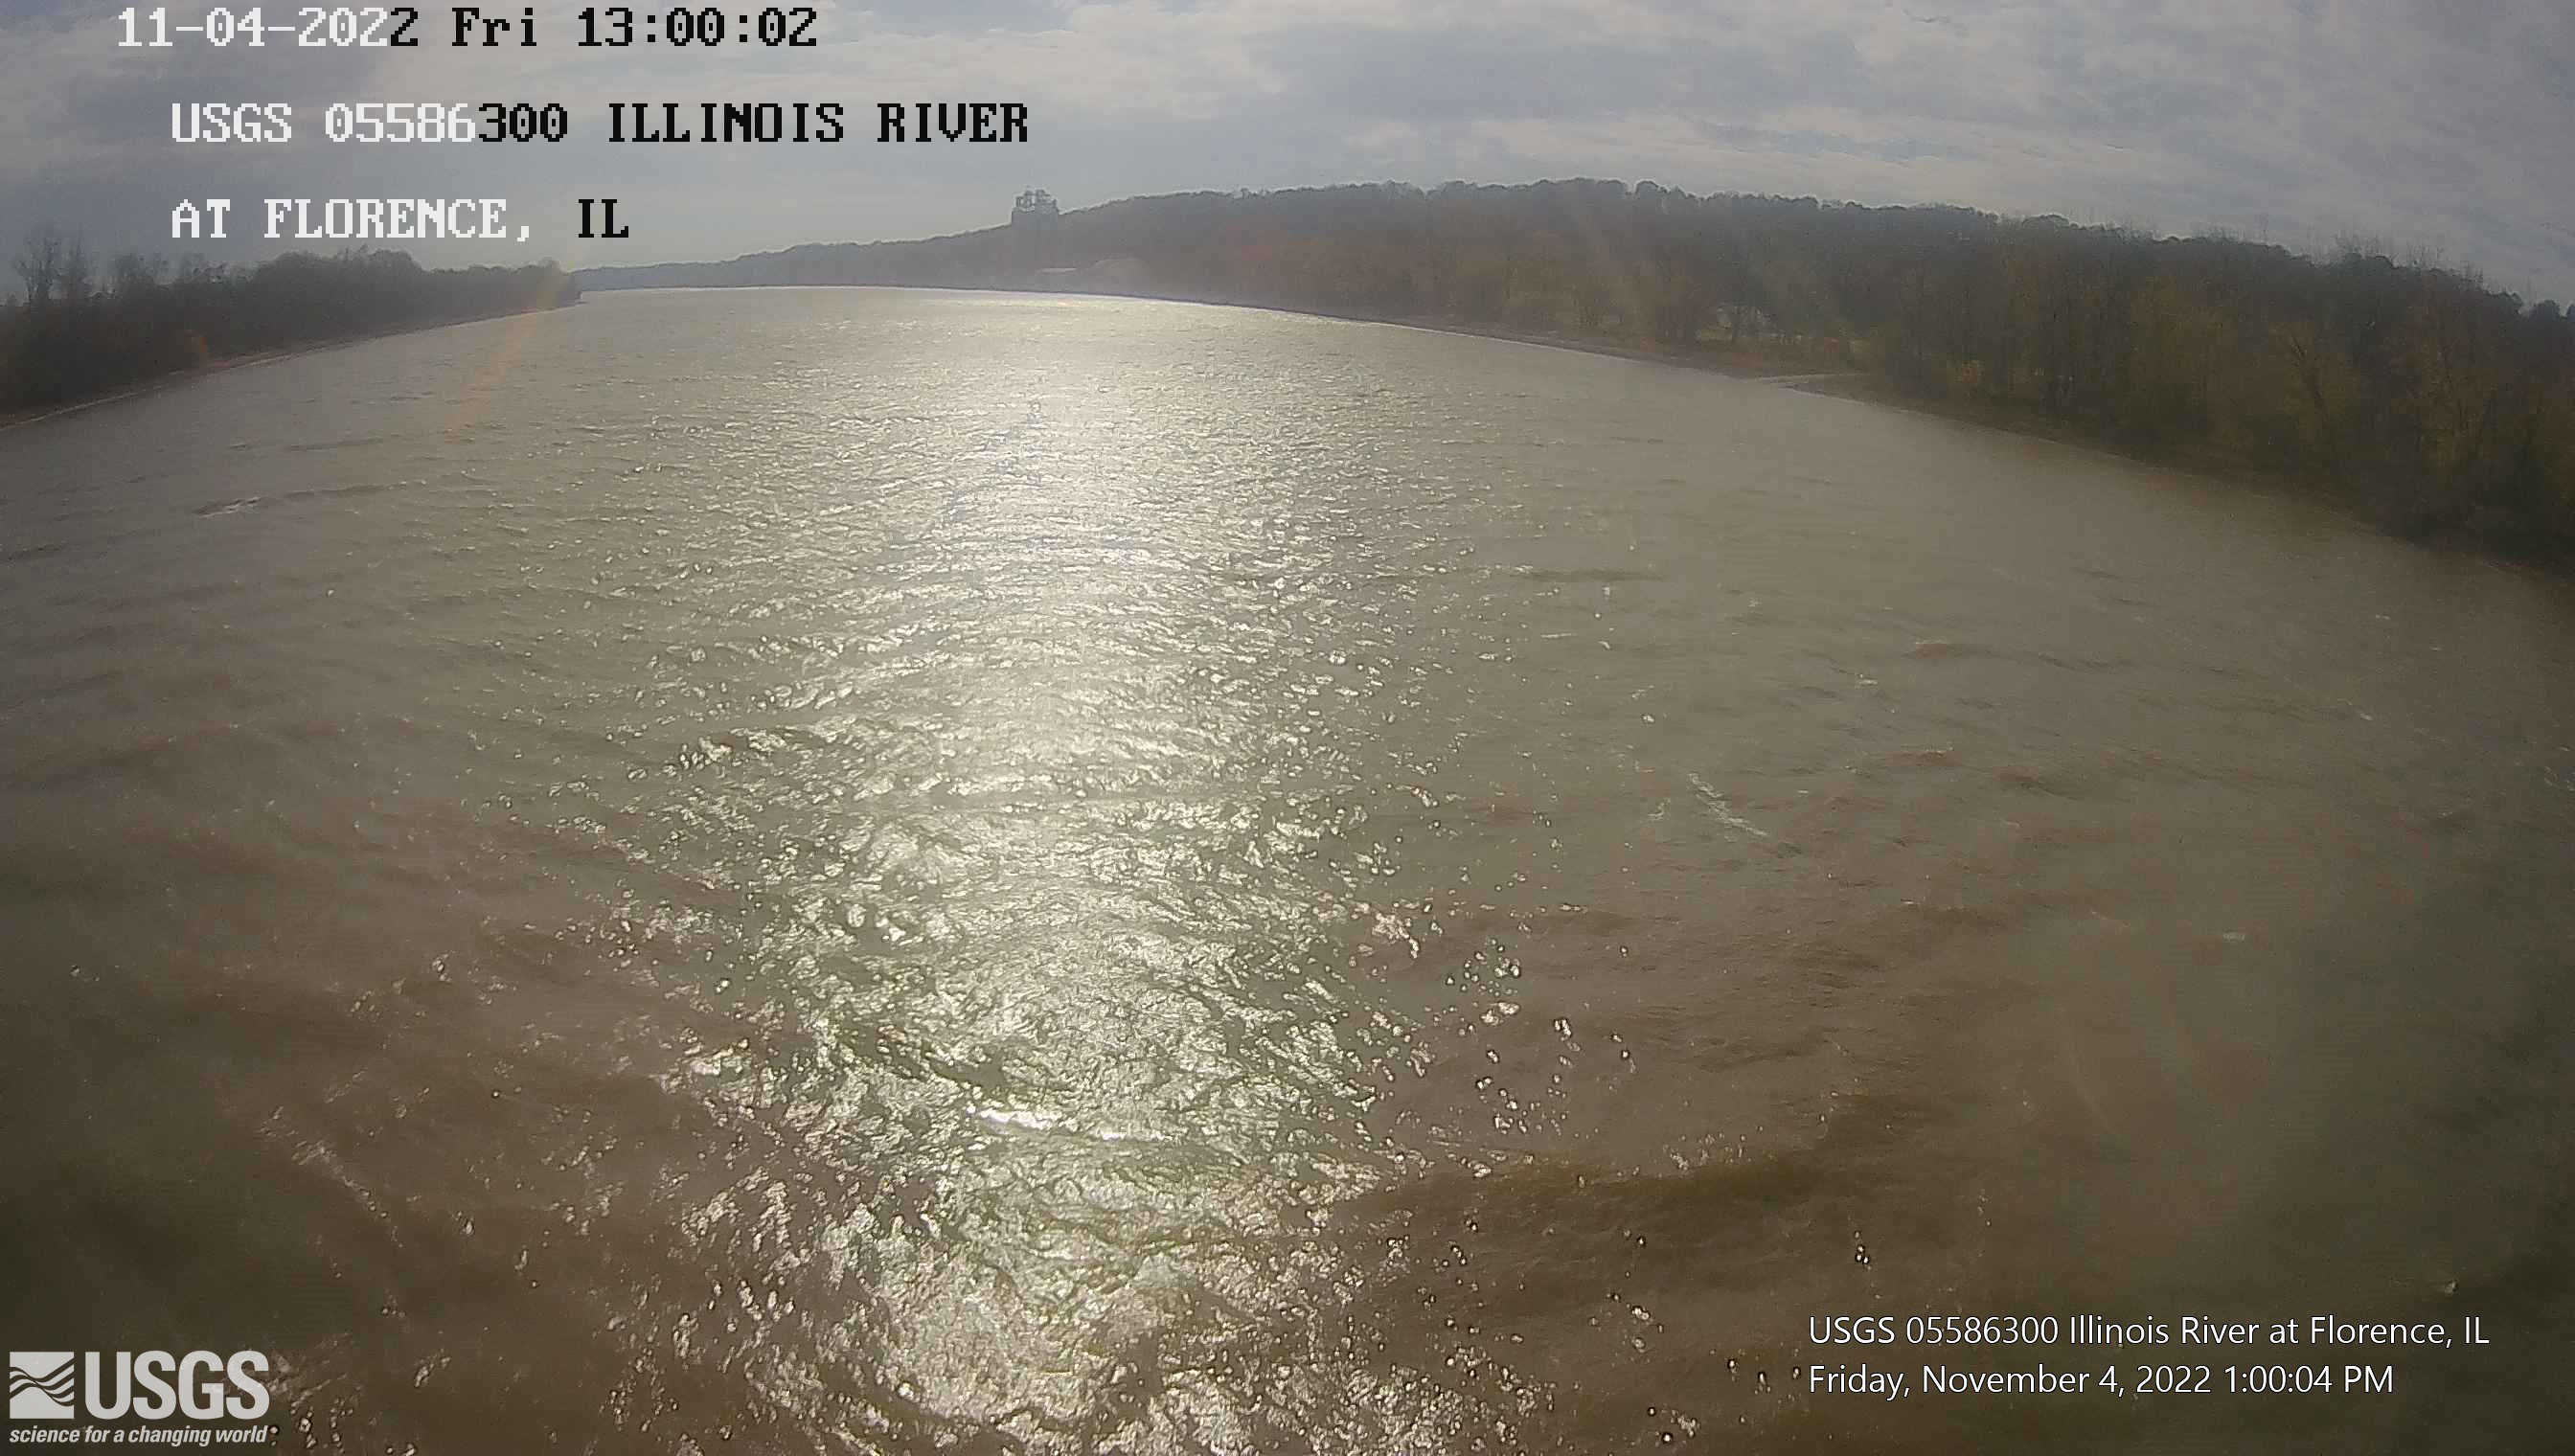
Streamgage 05586300 Illinois River at Florence, IL
Webcam at USGS Streamgage 05586300 Illinois River at Florence, IL.
Visit Water Data For the Nation to get current data for this site.
Webcam at USGS Streamgage 05586300 Illinois River at Florence, IL.
Visit Water Data For the Nation to get current data for this site.
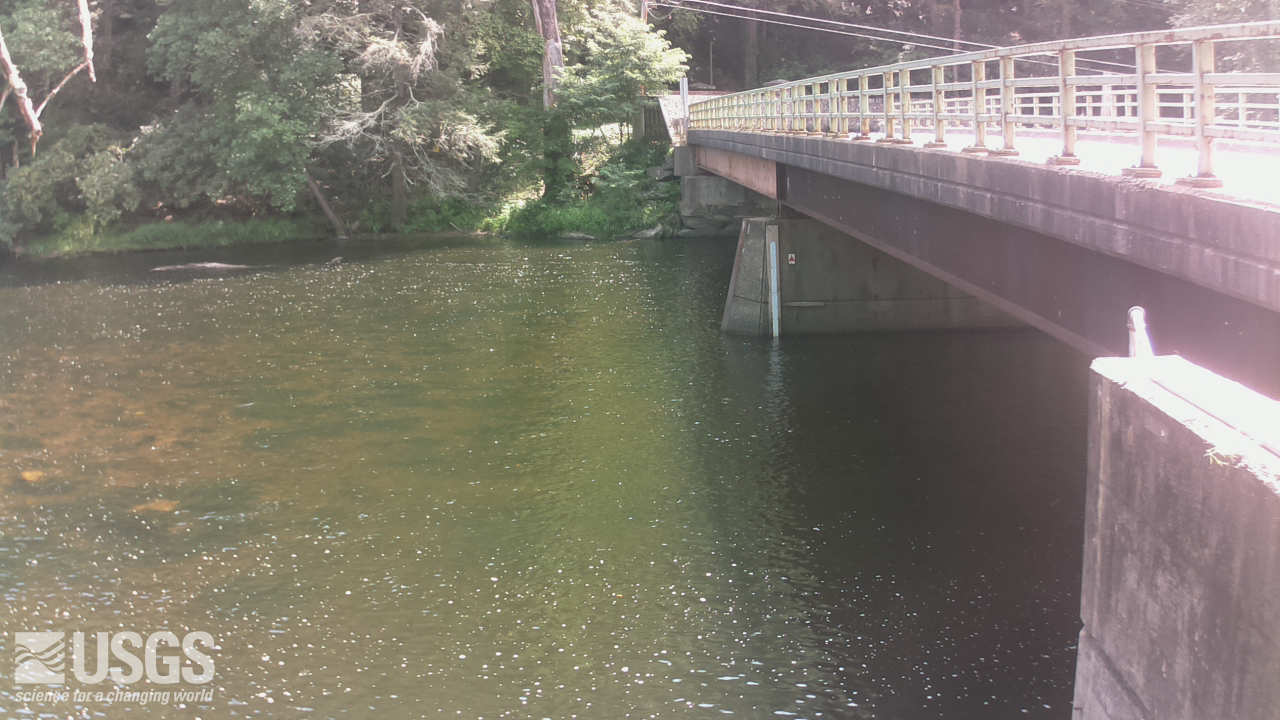
Streamgage 01437500 Neversink River at Godeffroy, NY
Webcam at USGS Streamgage 01437500 Neversink River at Godeffroy, NY.
Visit Water Data For the Nation to get current data for this site.
Webcam at USGS Streamgage 01437500 Neversink River at Godeffroy, NY.
Visit Water Data For the Nation to get current data for this site.
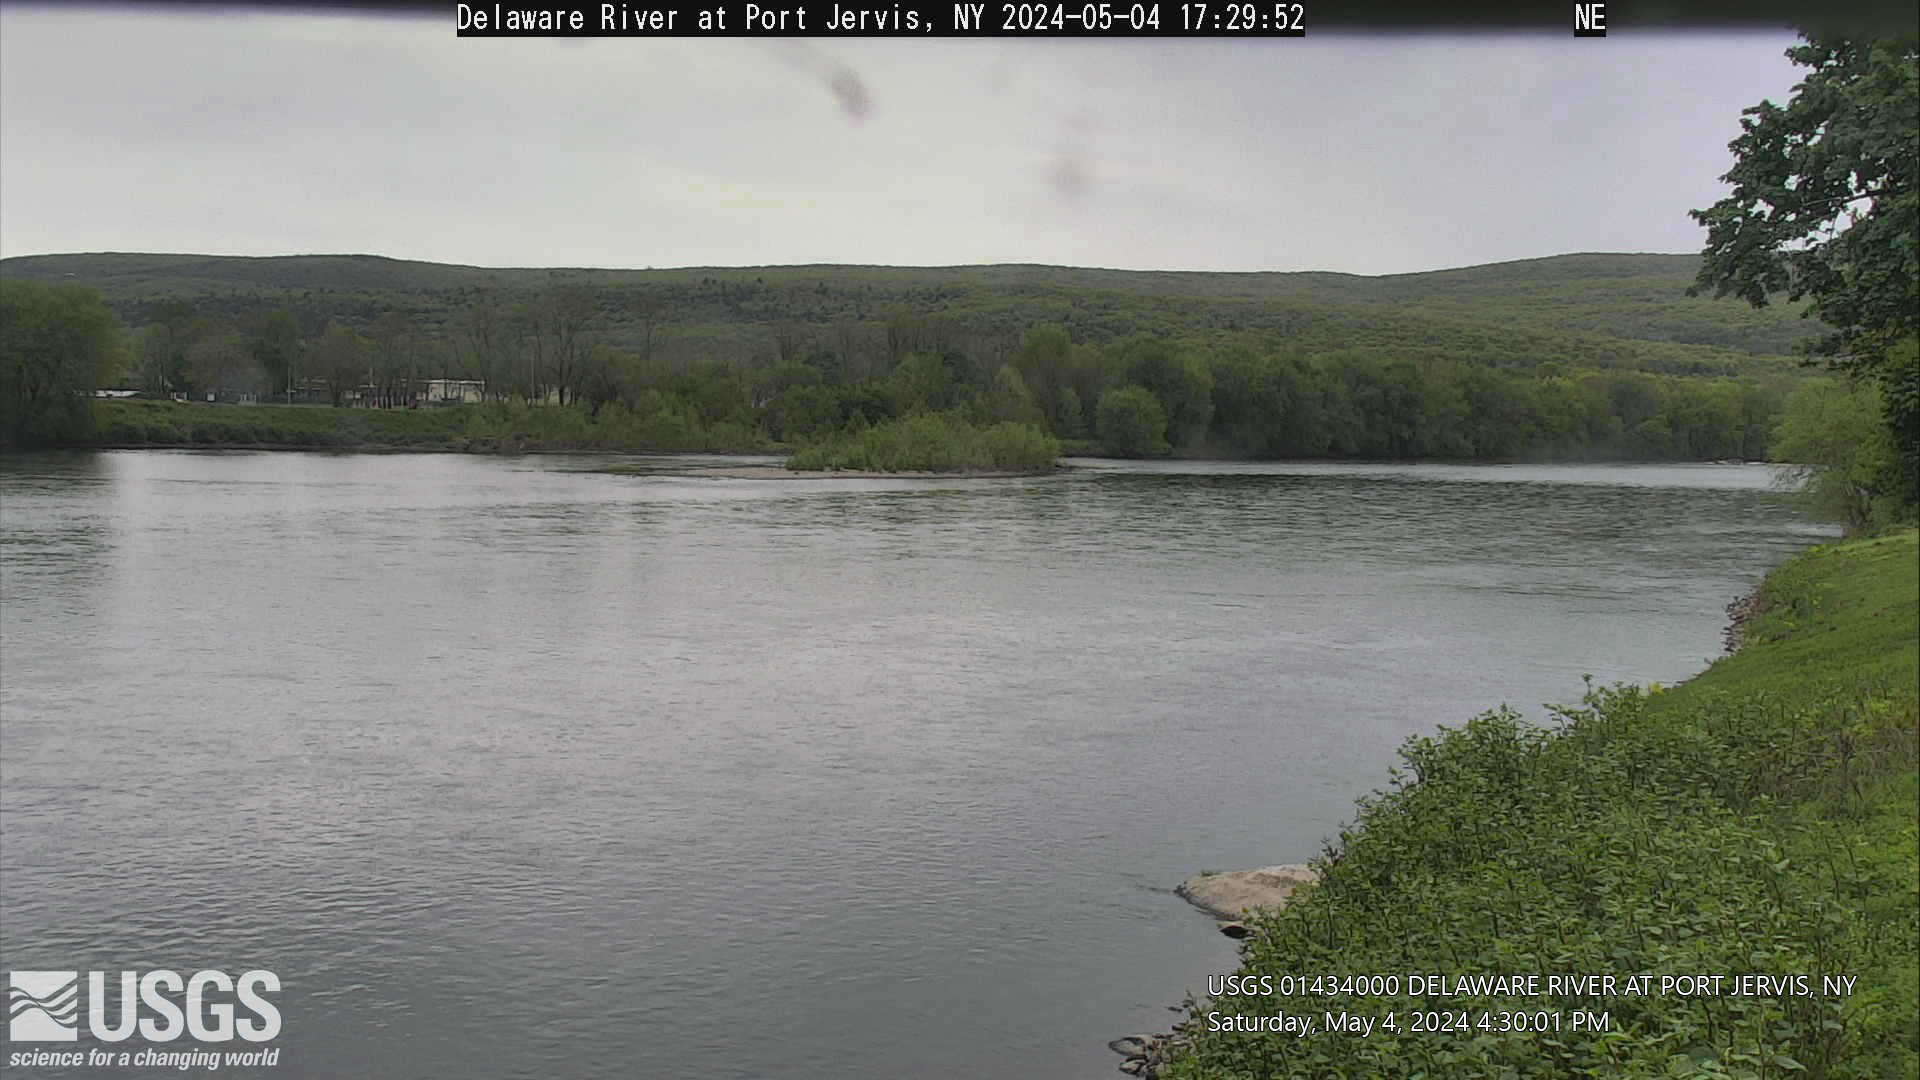
Streamgage 01434000 Delaware River at Port Jervis, NY
Webcam at USGS Streamgage 01434000 Delaware River at Port Jervis, NY.
Visit Water Data For the Nation to get current data for this site.
Webcam at USGS Streamgage 01434000 Delaware River at Port Jervis, NY.
Visit Water Data For the Nation to get current data for this site.
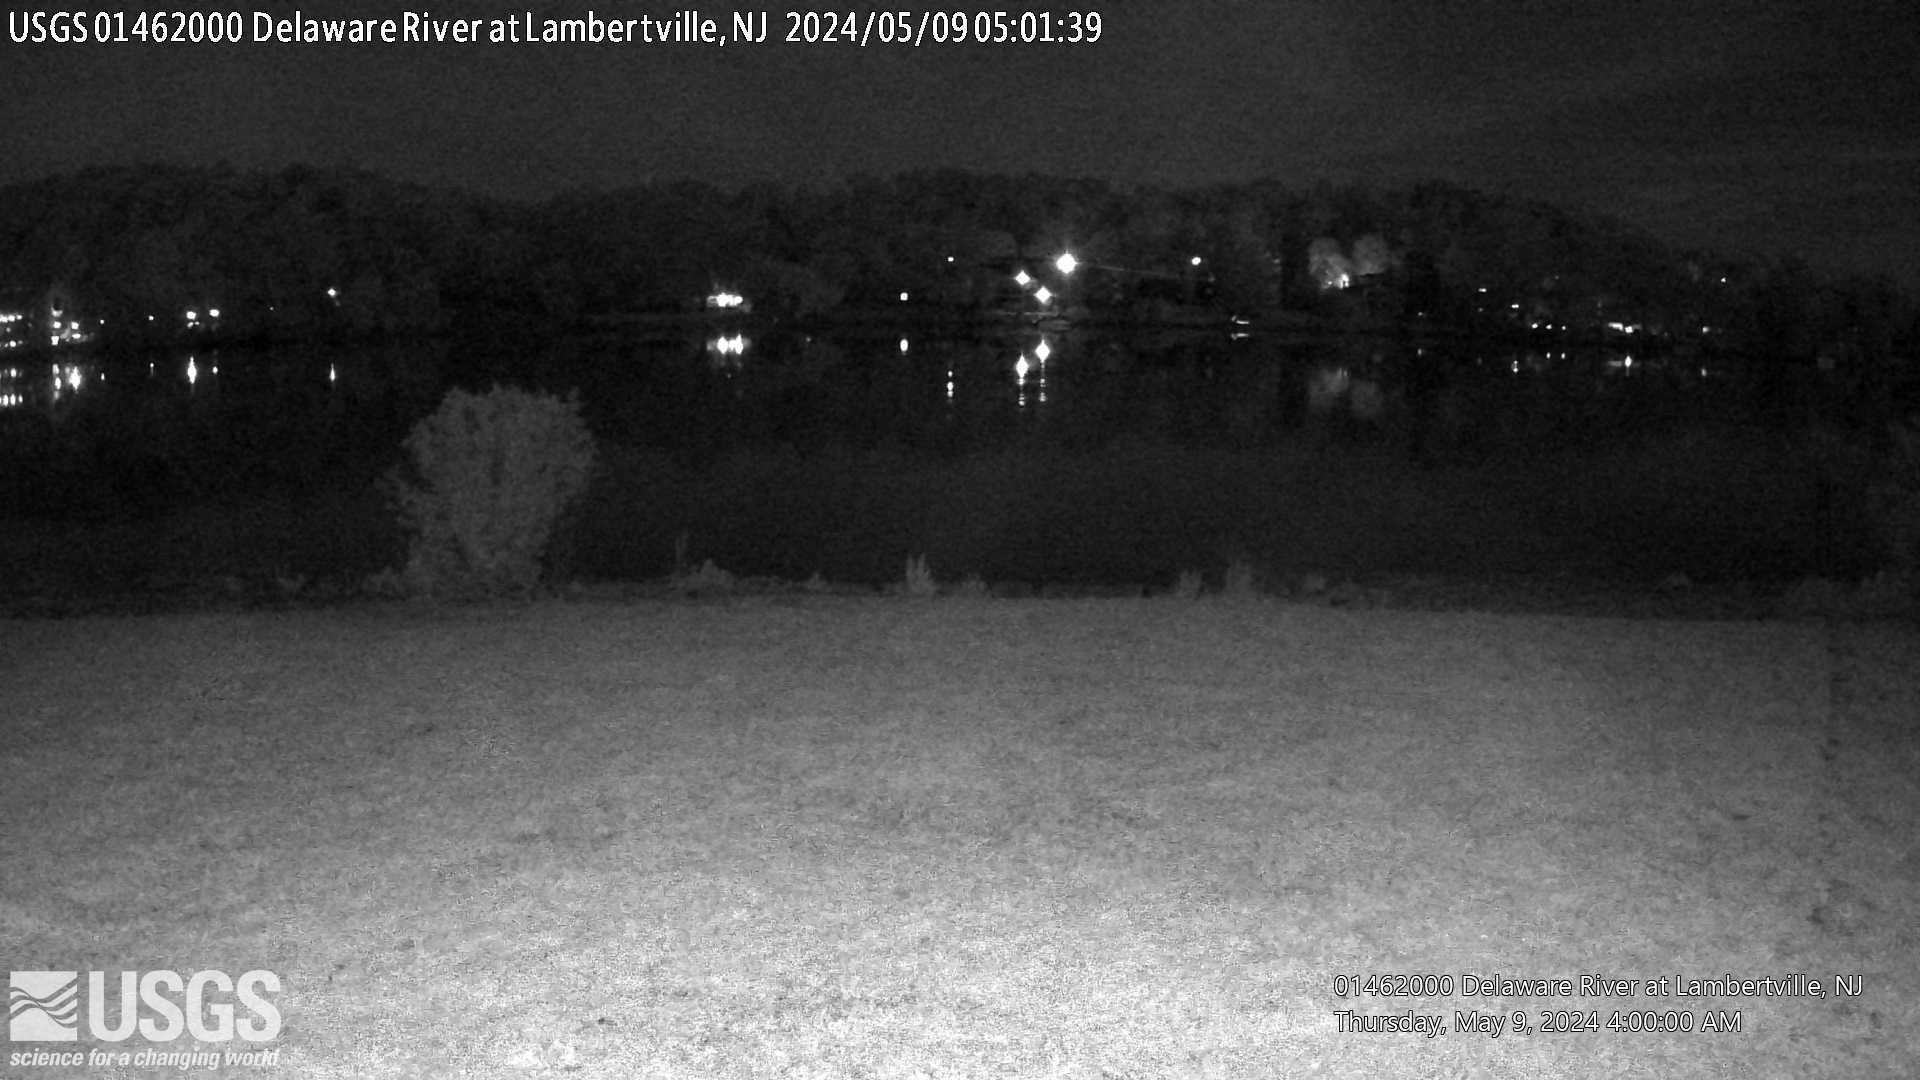
Streamgage 01462000 Delaware River at Lambertville, NJ
Webcam at USGS Streamgage 01462000 Delaware River at Lambertville, NJ.
Visit Water Data For the Nation to get current data for this site.
Webcam at USGS Streamgage 01462000 Delaware River at Lambertville, NJ.
Visit Water Data For the Nation to get current data for this site.