
Boulder Glacier - Chapman Peak - 2007 color
All Multimedia
Access all multimedia to include images, video, audio, webcams, before-after imagery, and more. Filter and explore with filtering options to refine search.
Filter Total Items: 26026

Boulder Glacier - Chapman Peak - 2007 color
Boulder Glacier - Chapman Peak - 2007 color

Broken Top volcano, inactive since 150 ka or longer, viewed to NW. ...
Radially dipping strata of the cone include subequal proportions of lava flows and flow breccias and of proximal agglutinate and scoria falls, nearly all having 54 to 56 percent SiO2. Numerous mafic dikes and sills intrude the cone, and an apron of compositionally similar mafic lavas extends far outward from the cone.
Radially dipping strata of the cone include subequal proportions of lava flows and flow breccias and of proximal agglutinate and scoria falls, nearly all having 54 to 56 percent SiO2. Numerous mafic dikes and sills intrude the cone, and an apron of compositionally similar mafic lavas extends far outward from the cone.

Data input heirarchy
Sediment texture and distribution data were mapped qualitatively in Esri ArcGIS using a hierarchical methodology. Backscatter data were the first input, followed by bathymetry, surficial geologic and shallow stratigraphic interpretations, and photograph and sample databases. DEM, digital elevation model.
Sediment texture and distribution data were mapped qualitatively in Esri ArcGIS using a hierarchical methodology. Backscatter data were the first input, followed by bathymetry, surficial geologic and shallow stratigraphic interpretations, and photograph and sample databases. DEM, digital elevation model.
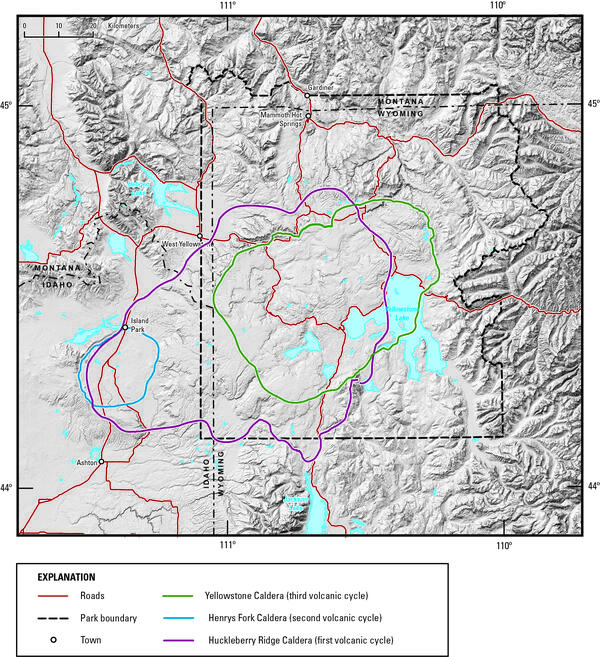
Digital elevation model of Yellowstone National Park and vicinity
Digital elevation model of Yellowstone National Park and vicinity, showing the location of the calderas formed during each of Yellowstone’s three most recent volcanic cycles. The youngest caldera-forming eruption produced Yellowstone Caldera (green line), located within Yellowstone National Park.
Digital elevation model of Yellowstone National Park and vicinity, showing the location of the calderas formed during each of Yellowstone’s three most recent volcanic cycles. The youngest caldera-forming eruption produced Yellowstone Caldera (green line), located within Yellowstone National Park.

Does Pleasure Point Need a Seawall?
The USGS, in cooperation with Santa Cruz County and the California Department of Boating and Waterways, studied the seacliffs, ocean floor, and waves of Pleasure Point, California. We created detailed maps of the seacliffs and ocean floor using LIDAR laser scanners and sonar.
The USGS, in cooperation with Santa Cruz County and the California Department of Boating and Waterways, studied the seacliffs, ocean floor, and waves of Pleasure Point, California. We created detailed maps of the seacliffs and ocean floor using LIDAR laser scanners and sonar.

Gas Hydrate Drill Rig at the Mt. Elbert Test Site in Alaska
A drill rig at the Mount Elbert test site in Alaska's North Slope, just west of Prudhoe Bay. USGS joined BP Exploration (Alaska) and the U.S. Department of Energy to drill a test well to study natural gas production from gas hydrate deposits. Read more about the Mt.
A drill rig at the Mount Elbert test site in Alaska's North Slope, just west of Prudhoe Bay. USGS joined BP Exploration (Alaska) and the U.S. Department of Energy to drill a test well to study natural gas production from gas hydrate deposits. Read more about the Mt.

Golden aspen, Jemez Mountains, NM.
Golden aspen, Jemez Mountains, NM.
Golden aspen, Jemez Mountains, NM.

Hydrothermal system and water flow in the subsurface beneath Long V...
Hydrothermal system and water flow in the subsurface beneath Long Valley Caldera, California. Cartoon Illustration from USGS FS 2007-3045.
Hydrothermal system and water flow in the subsurface beneath Long Valley Caldera, California. Cartoon Illustration from USGS FS 2007-3045.

Measuring bridge scour
Measuring bridge scour in Montana
Measuring bridge scour in Montana

Sediment Textures
Inner continental shelf sediment textures within western Massachusetts Bay classified using Barnhardt and others (1998). Bottom photographs A-D show sediment texture in select locations (photograph locations are shown as white dots on the sediment texture map).
Inner continental shelf sediment textures within western Massachusetts Bay classified using Barnhardt and others (1998). Bottom photographs A-D show sediment texture in select locations (photograph locations are shown as white dots on the sediment texture map).

Shaded relief image of Woods Hole, MA
Shaded relief image of Woods Hole, MA
Shaded relief image of Woods Hole, MA

Shipwreck near Cuttyhunk, MA
Shaded relief backscatter image of a shipwreck near Cuttyhunk, MA
Shaded relief backscatter image of a shipwreck near Cuttyhunk, MA

Single-well tracer test
Single-well tracer tests involve injecting a tracer solution into one port of a multilevel sampling well, creating a tracer cloud in the groundwater, and then monitoring the water chemistry in the tracer cloud from the same well as the tracer cloud moves away from the well.
Single-well tracer tests involve injecting a tracer solution into one port of a multilevel sampling well, creating a tracer cloud in the groundwater, and then monitoring the water chemistry in the tracer cloud from the same well as the tracer cloud moves away from the well.

Southern Gulf of Maine and Massachusetts coastal zone bathymetry
Image showing the bathymetry of the southern Gulf of Maine with the Massachusetts coastal zone boundary outlined in grey. The images on the right display how the geophysical and sample data are combined to create an interpretation of seafloor geology
Image showing the bathymetry of the southern Gulf of Maine with the Massachusetts coastal zone boundary outlined in grey. The images on the right display how the geophysical and sample data are combined to create an interpretation of seafloor geology

Swath Bathymetry
Swath bathymetry and derivative products such as slope, hillshaded relief, and rugosity maps provide information not only on water depth, but also the roughness and smoothness of the sea floor, which correlates with sea floor texture and depositional environment.
Swath bathymetry and derivative products such as slope, hillshaded relief, and rugosity maps provide information not only on water depth, but also the roughness and smoothness of the sea floor, which correlates with sea floor texture and depositional environment.

Time-lapse images of Mount St. Helens dome growth 2004-2008
The rapid onset of unrest at Mount St. Helens on September 23, 2004 initiated an uninterrupted lava-dome-building eruption that continued until 2008. The initial phase produced rapid growth of a lava dome as magma pushed upward.
The rapid onset of unrest at Mount St. Helens on September 23, 2004 initiated an uninterrupted lava-dome-building eruption that continued until 2008. The initial phase produced rapid growth of a lava dome as magma pushed upward.

USGS 2007 Wildfire Response
Michael Shulter (USGS) Director, California Water Science Center discusses the USGS's science and collaborative efforts regarding the 2007 California wildfires.
Michael Shulter (USGS) Director, California Water Science Center discusses the USGS's science and collaborative efforts regarding the 2007 California wildfires.

USGS and 2007 California Wildfires: Ash Study
USGS scientists talk about the importance of spectral data, the instrumentation used, and what USGS brings to the table regarding fire science.
USGS scientists talk about the importance of spectral data, the instrumentation used, and what USGS brings to the table regarding fire science.

USGS and 2007 California Wildfires: The Big Picture
Robert Fisher, USGS Research Biologist talks about the overall impact of fires on the biology of the area.
Robert Fisher, USGS Research Biologist talks about the overall impact of fires on the biology of the area.

USGS and 2007 California Wildfires: Very Endangered Trout
Adam Backlin, USGS Ecologist, talks about the potential dangers to the aquatic life in the streams around the Santa Ana Mountains as a result of the 2007 California wildfires.
Adam Backlin, USGS Ecologist, talks about the potential dangers to the aquatic life in the streams around the Santa Ana Mountains as a result of the 2007 California wildfires.
")
USGS and California Wildfires: Post Fire Debris Flow (part 1)
Jim Bowers, USGS, California Hydrologic Monitoring Program Chief, talks about an historic streamflow site that was buried by debris flows as a result of the 2003 fires.
Jim Bowers, USGS, California Hydrologic Monitoring Program Chief, talks about an historic streamflow site that was buried by debris flows as a result of the 2003 fires.