
An earthquake along a subduction zone happens when the leading edge of the overriding plate breaks free and springs seaward, raising the sea floor and the water above it. This uplift starts a tsunami. Meanwhile, the bulge behind the leading edge collapses, thinning the plate and lowering coastal areas.
All Multimedia
Access all multimedia to include images, video, audio, webcams, before-after imagery, and more. Filter and explore with filtering options to refine search.
Filter Total Items: 26025

Earthquake starts tsunami
An earthquake along a subduction zone happens when the leading edge of the overriding plate breaks free and springs seaward, raising the sea floor and the water above it. This uplift starts a tsunami. Meanwhile, the bulge behind the leading edge collapses, thinning the plate and lowering coastal areas.

Station 08028500 Sabine River near Bon Wier, Texas
U.S. Geological Survey streamflow-gaging station 08028500 Sabine River near Bon Wier, Texas, photograph looking from left bank adjacent to U.S. Highway 190 bridge, May 30, 1999.
SIR 2009–5174
U.S. Geological Survey streamflow-gaging station 08028500 Sabine River near Bon Wier, Texas, photograph looking from left bank adjacent to U.S. Highway 190 bridge, May 30, 1999.
SIR 2009–5174

Antibiotics in Groundwater Tracer Injection
U.S. Geological Survey (USGS) scientists conducted a unique study, which demonstrated that the ecology of natural groundwater bacteria changed after exposure of the bacteria to the antibiotic sulfamethoxazole (SMX).
U.S. Geological Survey (USGS) scientists conducted a unique study, which demonstrated that the ecology of natural groundwater bacteria changed after exposure of the bacteria to the antibiotic sulfamethoxazole (SMX).

Grant Glacier - 1998
Grant Glacier - 1998

Mapping Shipping Hazards in San Francisco Bay, 1997-1998
Large-scale poster describing USGS work.
The USGS mapped western San Francisco Bay using sonar, in cooperation with the National Oceanic and Atmospheric Administration (NOAA) and C&C Technologies. Some parts of the Bay floor are so shallow that a large tanker or container ship could run aground at low tide and create a massive oil spill.

Researcher in Mojave Desert
One of 1,695 repeat photographs taken to provide context for the classification of the Central Mojave Desert into various vegetation classes.
One of 1,695 repeat photographs taken to provide context for the classification of the Central Mojave Desert into various vegetation classes.

Measuring a Superheated Fumarole
USGS geochemist Bill Evans measures the temperature of a superheated (hotter than the boiling point) fumarole in Lassen Volcanic National Park.
USGS geochemist Bill Evans measures the temperature of a superheated (hotter than the boiling point) fumarole in Lassen Volcanic National Park.

A Red-Faced Warbler in Arizona
Red-faced warblers are one of the species affected by climate change in the form of reduced snowpack in the Arizona Mountains, according to a USGS Montana Cooperative Wildlife Research Unit study.
Red-faced warblers are one of the species affected by climate change in the form of reduced snowpack in the Arizona Mountains, according to a USGS Montana Cooperative Wildlife Research Unit study.

Coastal Dune with Seaoats (Uniola paniculata) and Spanish Bayonets (Yucca Sp.)
Florida's Atlantic coastal dune with typical vegetation such as seaoats and Spanish bayonets. Trails to the beach cut through the dune. Photograph taken circa 1998.
Florida's Atlantic coastal dune with typical vegetation such as seaoats and Spanish bayonets. Trails to the beach cut through the dune. Photograph taken circa 1998.

Red Mangrove Islands (Rhizophora mangle)
Several red mangrove "islands" in an intracoastal waterway. Photograph taken circa 1998.
Several red mangrove "islands" in an intracoastal waterway. Photograph taken circa 1998.

Cecilioides Consobrinus
Cecioides consobrinus shell viewed with a scanning electron microscope with aperture facing up.
Cecioides consobrinus shell viewed with a scanning electron microscope with aperture facing up.

1997 NSLRSDA 14 minutes
A 1997 presentation on the National Satellite Land Remote Sensing Data Archive, led by the USGS Earth Resources Observation and Science (EROS) Center
A 1997 presentation on the National Satellite Land Remote Sensing Data Archive, led by the USGS Earth Resources Observation and Science (EROS) Center
Geologic map of Mauna Kea with generalized surface distribution of ...
Geologic map of Mauna Kea with generalized surface distribution of Hamakua Volcanics. Laupahoehoe Volcanics are inferred to overlie a vast area of Hamakua Volcanics on the upper flanks and summit.
Geologic map of Mauna Kea with generalized surface distribution of Hamakua Volcanics. Laupahoehoe Volcanics are inferred to overlie a vast area of Hamakua Volcanics on the upper flanks and summit.

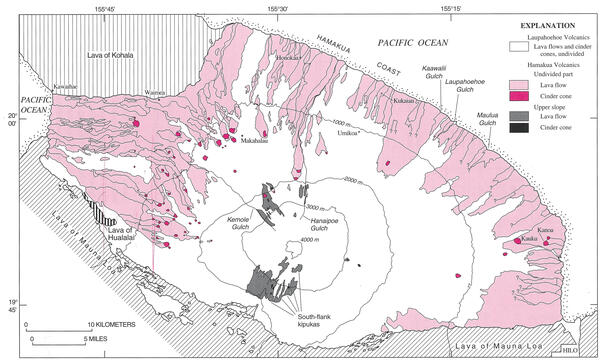
Geologic map of Mauna Kea, showing generalized distribution of lava...
Geologic map of Mauna Kea, showing generalized distribution of lava flows, cinder cones, and glacial deposits of the Laupahoehoe Volcanics.
Geologic map of Mauna Kea, showing generalized distribution of lava flows, cinder cones, and glacial deposits of the Laupahoehoe Volcanics.

Seattle Area Monitoring site
Photograph showing the scar left by a landslide on a hillside above the Burlington Northern Santa Fe Railway in Everett, Washington.
Photograph showing the scar left by a landslide on a hillside above the Burlington Northern Santa Fe Railway in Everett, Washington.

Seattle Area Monitoring site
Photograph showing a house that was damaged by a 1997 landslide along Perkins Lane in Seattle, Washington.
Photograph showing a house that was damaged by a 1997 landslide along Perkins Lane in Seattle, Washington.

Rock and ice debris (Oct. 20, 1997) on east side of Mount Adams
Rock and ice debris avalanche (October 20, 1997) on the east side of Mount Adams.
Rock and ice debris avalanche (October 20, 1997) on the east side of Mount Adams.

Coso Volcanic Field Tumulus
A tumulus in the Coso Volcanic Field, California. This lava was probably more viscous than the lava found in the Hawaii tumuli.
A tumulus in the Coso Volcanic Field, California. This lava was probably more viscous than the lava found in the Hawaii tumuli.

Measuring White Sturgeons
Juvenile white sturgeons on measuring board.
Juvenile white sturgeons on measuring board.

A'a' Channel
An a'a' channel near the Royal Gardens subdivision on Kilauea Volcano, Hawaii. The flows in the background are from the 1980s. Note that the flow level is below the levees and the pahoehoe overflows emplaced on top of the a'a'.
An a'a' channel near the Royal Gardens subdivision on Kilauea Volcano, Hawaii. The flows in the background are from the 1980s. Note that the flow level is below the levees and the pahoehoe overflows emplaced on top of the a'a'.

A'a' Channel
Detail of levee on an active channelized aa flow. Note the pahoehoe overflows in the levees and the level of the active flow below the tops of the levees. This lower flow level is not allowed in the commonly used "Bingham" model of lava flows.
Detail of levee on an active channelized aa flow. Note the pahoehoe overflows in the levees and the level of the active flow below the tops of the levees. This lower flow level is not allowed in the commonly used "Bingham" model of lava flows.