
Platte River near Alda, Nebraska at sunset, Nov. 6, 2006.
Images
Explore our planet through photography and imagery, including climate change and water all the way back to the 1800s when the USGS was surveying the country by horse and buggy.
Filter Total Items: 21558

Platte River near Alda, Nebraska at sunset.
Platte River near Alda, Nebraska at sunset, Nov. 6, 2006.

Station 08026000 Sabine River near Burkeville, Tex.
U.S. Geological Survey streamflow-gaging station 08026000 Sabine River near Burkeville, Texas, photograph looking upstream from bridge on State Highway 63, November 9, 2006.
SIR 2009–5174
U.S. Geological Survey streamflow-gaging station 08026000 Sabine River near Burkeville, Texas, photograph looking upstream from bridge on State Highway 63, November 9, 2006.
SIR 2009–5174

Death Valley
Field trip to Death Valley. John Mars (USGS), Simon Hook (JPL), C.R. Souza Filho (University of Campinas), Giles Marion (Desert Research Institute)
Field trip to Death Valley. John Mars (USGS), Simon Hook (JPL), C.R. Souza Filho (University of Campinas), Giles Marion (Desert Research Institute)

Death Valley
Field trip to Death Valley. Jim Crowley (USGS), Giles Marion (Desert Research Institute), John Mars (USGS).
Field trip to Death Valley. Jim Crowley (USGS), Giles Marion (Desert Research Institute), John Mars (USGS).

Death Valley
Field trip to Death Valley. John Mars (USGS). Giles Marion (Desert Research Institute), Jim Crowley (USGS), Simon Hook (JPL).
Field trip to Death Valley. John Mars (USGS). Giles Marion (Desert Research Institute), Jim Crowley (USGS), Simon Hook (JPL).

Baling Hay
Loading hay from a field in East Texas.
Loading hay from a field in East Texas.

Baling Hay
Loading hay from a field in East Texas.
Loading hay from a field in East Texas.

Lake Whitefish
Lake Whitefish from our fall survey.

Three Bottle-Fed Baby Goats
Baby goats in Texas that were rejected by their various mothers, being fed bottled milk.
Baby goats in Texas that were rejected by their various mothers, being fed bottled milk.

Figure 1. Appearance of Descaling Site Exposed to Fast Green FCF Dye
Figure 1. Appearance of descaling site exposed to fast green FCF dye six hours after intentional descaling injury, showing loss of scales and presence of fast green staining. Areas of unintentional integumental injury are also stained (arrows).
Related image Figure 2.
Figure 1. Appearance of descaling site exposed to fast green FCF dye six hours after intentional descaling injury, showing loss of scales and presence of fast green staining. Areas of unintentional integumental injury are also stained (arrows).
Related image Figure 2.

Figure 2. Scanning Electron Micrograph of Descaling Area
Figure 2. Scanning electron micrograph of descaling area delimited by box in Figure 1 showing epidermal disruption, empty scale pockets and an exposed scale with visible concentric ridges (upper right). Scale bar = 500 µm.
Figure 2. Scanning electron micrograph of descaling area delimited by box in Figure 1 showing epidermal disruption, empty scale pockets and an exposed scale with visible concentric ridges (upper right). Scale bar = 500 µm.

Summit of Glacier Peak, WA, view toward the east.
Summit of Glacier Peak, Washington, view toward the east.
Summit of Glacier Peak, Washington, view toward the east.

Figure 3. Appearance of Descaling Site Exposed to Fast Green FCF Dye
Figure 3. Appearance of descaling site exposed to fast green FCF dye 96 hours after intentional descaling injury, showing lack of scales, presence of fast green staining in areas of epidermal disruption and absence of staining in areas where migrating epidermal cells have closed the wound.
Figure 3. Appearance of descaling site exposed to fast green FCF dye 96 hours after intentional descaling injury, showing lack of scales, presence of fast green staining in areas of epidermal disruption and absence of staining in areas where migrating epidermal cells have closed the wound.

Figure 4. Scanning Electron Micrograph of Descaling Area
Figure 4. Scanning electron micrograph of descaling area delimited by box in Figure 3 showing epidermal disruption (arrows), empty scale pockets and restoration of epidermal integrity (asterisk). An exposed scale with visible concentric ridges is visible at the lower center. Scale bar = 500 µm.
Figure 4. Scanning electron micrograph of descaling area delimited by box in Figure 3 showing epidermal disruption (arrows), empty scale pockets and restoration of epidermal integrity (asterisk). An exposed scale with visible concentric ridges is visible at the lower center. Scale bar = 500 µm.

Crooked River at Smith Rocks
Crooked River of the Deschutes River Basin, Oregon, flows through Smith Rocks
Crooked River of the Deschutes River Basin, Oregon, flows through Smith Rocks

Streamflow-gaging station 08096500 Brazos River at Waco
U.S. Geological Survey streamflow-gaging station 08096500 Brazos River at Waco, Texas, photograph looking upstream at the Brazos River (Lake Brazos) from the State Loop 340 bridge, October 25, 2006.
SIR 2009–5174
U.S. Geological Survey streamflow-gaging station 08096500 Brazos River at Waco, Texas, photograph looking upstream at the Brazos River (Lake Brazos) from the State Loop 340 bridge, October 25, 2006.
SIR 2009–5174

Active lava delta on south coast of Kīlauea, Hawai‘i
This lava delta at Lae‘apuki added about 24 hectares (60 acres) of new land to the southeast coast of Kīlauea in 2006, but 6.5 hectares (16 acres) slid into the sea in 2007. White plume marks location of lava entering the sea through a tube whose location is shown by blueish fume in middle right.
This lava delta at Lae‘apuki added about 24 hectares (60 acres) of new land to the southeast coast of Kīlauea in 2006, but 6.5 hectares (16 acres) slid into the sea in 2007. White plume marks location of lava entering the sea through a tube whose location is shown by blueish fume in middle right.

U.S. Geological Survey streamflow-gaging station 080305
U.S. Geological Survey streamflow-gaging station 08030500 Sabine River near Ruliff, Texas, photograph looking from left bank adjacent to State Highway 12 bridge, October 24, 2006.
SIR 2009–5174
U.S. Geological Survey streamflow-gaging station 08030500 Sabine River near Ruliff, Texas, photograph looking from left bank adjacent to State Highway 12 bridge, October 24, 2006.
SIR 2009–5174

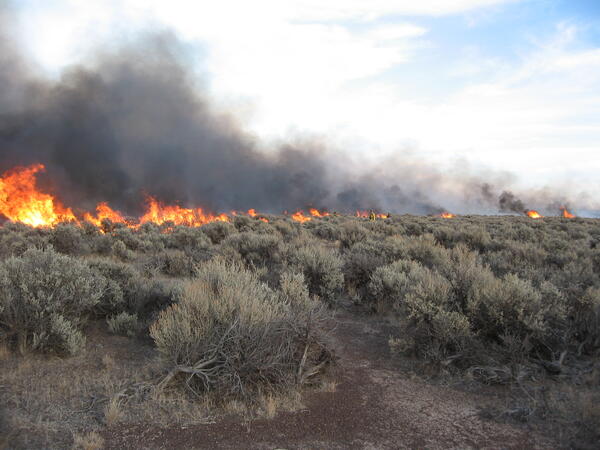
Burning Sagebrush
This is sagebrush burning at Hart Mountain National Antelope Refuge in association with a management project located 65 miles northeast of Lakeview, OR.
This is sagebrush burning at Hart Mountain National Antelope Refuge in association with a management project located 65 miles northeast of Lakeview, OR.

Controlled burn at Hart Mountain National Wildlife Refuge
controlled burn at Hart Mountain National Wildlife Refuge
controlled burn at Hart Mountain National Wildlife Refuge
Controlled burn at Hart Mountain National Wildlife Refuge.
Wildfire is one of the largest sources of re-released mercury to the atmosphere and a component to the widespread movement of inorganic mercury to aquatic sediments.
Wildfire is one of the largest sources of re-released mercury to the atmosphere and a component to the widespread movement of inorganic mercury to aquatic sediments.