
Steve Suttles and Neil Ganju surveying the position of a deployed oceanographic platform in Great South Bay, NY
Images
Images intro.
Filter Total Items: 2135

Scientific Research in Great South Bay, NY
Steve Suttles and Neil Ganju surveying the position of a deployed oceanographic platform in Great South Bay, NY

Map of Marsh shoreline change rates
Map of Edwin B Forsythe National Wildlife Refuge, N.J., marsh shoreline change rates.
Map of Edwin B Forsythe National Wildlife Refuge, N.J., marsh shoreline change rates.

Barnegat Bay Little Egg Harbor Study Site
Barnegat Bay Little Egg Harbor Study Site

Basemap image of the survey locations, south of Long Island, NY
Basemap image of the survey locations south of Long Island Sound
Basemap image of the survey locations south of Long Island Sound

Bathymetry and Elevation Models of the Massachusetts Coastal Zone
Overview of the 4 Continuous Bathymetry and Elevation Models of the Massachusetts Coastal Zone and Continental Shelf
Overview of the 4 Continuous Bathymetry and Elevation Models of the Massachusetts Coastal Zone and Continental Shelf
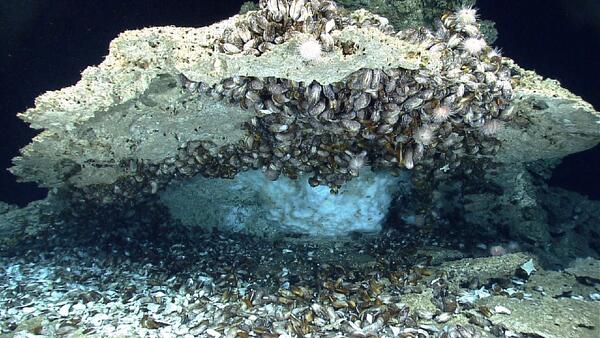
Ice-like gas hydrates under capping rock encrusted with mussels
Ice-like gas hydrates under capping rock encrusted with mussels on the sea floor of the northern Gulf of Mexico.
Ice-like gas hydrates under capping rock encrusted with mussels on the sea floor of the northern Gulf of Mexico.

Piping Plovers
An interdisciplinary USGS team is conducting research and developing tools to identify suitable coastal habitats for species of concern, such as the piping plover (Charadrius melodus), under a variety of sea-level rise scenarios.
An interdisciplinary USGS team is conducting research and developing tools to identify suitable coastal habitats for species of concern, such as the piping plover (Charadrius melodus), under a variety of sea-level rise scenarios.

Browse collage for 2017-003-FA data release
Browse collage for 2017-003-FA data release
Browse collage for 2017-003-FA data release

Browse collage for 2017-003-FA data release
Browse collage for 2017-003-FA data release
Browse collage for 2017-003-FA data release

Elevation Model
Basemap of the United States with an overview image of elevation models
Basemap of the United States with an overview image of elevation models

Browse graphic of data
Browse graphic of the sediment textuer and geomorphology data of the sea floor from Fenwick Island, MD to FIsherman's Island, VA
Browse graphic of the sediment textuer and geomorphology data of the sea floor from Fenwick Island, MD to FIsherman's Island, VA

Cenote Bang
Cenote Bang, a component of the Ox Bel Ha cave network study site and model for coastal karst subterranean estuary
Cenote Bang, a component of the Ox Bel Ha cave network study site and model for coastal karst subterranean estuary

Location Map of HARS site
Location map of HARS site

Lake Powell Geophysical Survey
USGS R/V Stephens operating within Lake Powell, UT-AZ. A multibeam echosounder is deployed off the starboard side of the vessel and is used to collect depth information within the reservoir.
USGS R/V Stephens operating within Lake Powell, UT-AZ. A multibeam echosounder is deployed off the starboard side of the vessel and is used to collect depth information within the reservoir.

Location map of the survey area for Hudson Canyon
Location map of the Hudson Canyon survey area.
Location map of the Hudson Canyon survey area.

Location Map of Atlantic Beach artificial reef, offshore of New York
Location Map of Atlantic Beach artificial reef, offshore of New York
Location Map of Atlantic Beach artificial reef, offshore of New York

Location Map for Sandy Hook artificial reef
Location map for Bathymetry and backscatter intensity of the sea floor of the Sandy Hook artificial reef, offshore of New Jersey, data release.
Location map for Bathymetry and backscatter intensity of the sea floor of the Sandy Hook artificial reef, offshore of New Jersey, data release.

Cassandra Ladino receives the 2017 CDI Leadership and Innovation Award
From left to right: Associate Director for Core Science Systems Kevin Gallagher, Physical Scientist Cassandra Ladino, and Chief, Office of Enterprise Information/Associate Chief Information Officer Tim Quinn.
From left to right: Associate Director for Core Science Systems Kevin Gallagher, Physical Scientist Cassandra Ladino, and Chief, Office of Enterprise Information/Associate Chief Information Officer Tim Quinn.

Richard Signell receives the 2017 CDI Leadership and Innovation Award
From left to right: Associate Director for Core Science Systems Kevin Gallagher, Research Oceanographer Rich Signel, and Chief, Office of Enterprise Information/Associate Chief Information Officer Tim Quinn.
From left to right: Associate Director for Core Science Systems Kevin Gallagher, Research Oceanographer Rich Signel, and Chief, Office of Enterprise Information/Associate Chief Information Officer Tim Quinn.
Diagram: different ocean features that contribute to coastal flooding
Diagram of different ocean features that contribute to coastal flooding.
Diagram of different ocean features that contribute to coastal flooding.
Map showing the amount of sea-level rise that will double the chances
Map showing the amount of sea-level rise that will double the chances of today’s “50-year floods,” which have a 2 percent chance of happening in any year. Warmer colors indicate areas at greater risk.
Map showing the amount of sea-level rise that will double the chances of today’s “50-year floods,” which have a 2 percent chance of happening in any year. Warmer colors indicate areas at greater risk.