Figure 4 in Modeling the potential habitat gained from planting sagebrush in burned landscapes

Detailed Description
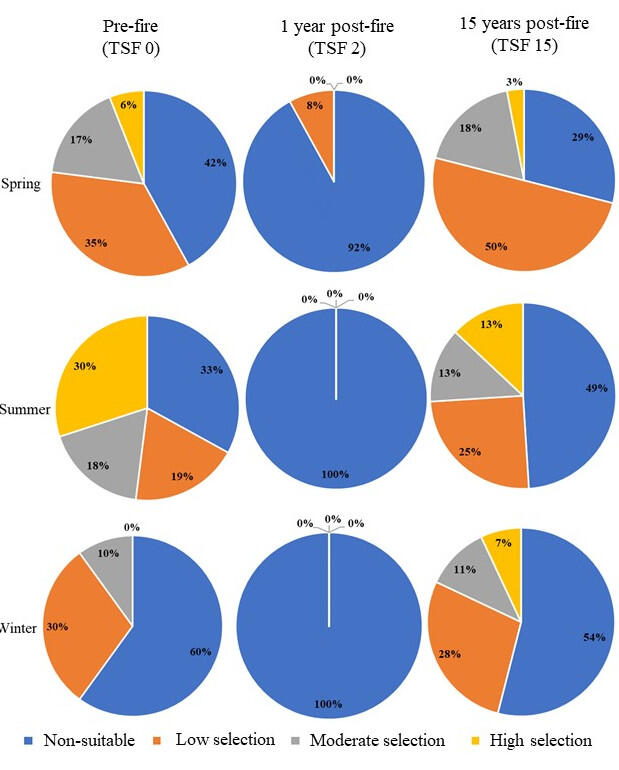
Figure 2. Percentage of recovered Greater sage-grouse habitat using linked post-fire vegetation transition and habitat selection models. Recovery reflects habitat suitability within a simulated burn perimeter (35,362 ha) derived from projected habitat selection. In these charts, selection classifications were averaged across sagebrush planting scenarios (n=48) for pre-fire (left), the year of the fire (center), and 15 years after fire relative to spring (breeding; top), summer (middle), and winter (bottom) seasons. TSF = time since fire. (Figure 4 in Modeling the potential habitat gained from planting sagebrush in burned landscapes). This article is an open access article distributed under the terms and conditions of the Creative Commons Attribution (CC BY) license (https://creativecommons.org/licenses/by/4.0/).
Sources/Usage
Public Domain.


