U.S. flag

An official website of the United States government

Images

Images intro.
Filter Total Items: 7146
Please click on image for full description and image details.
2019 Ridgecrest Earthquake Sequence: July 4, 2019–July 16, 2019

3,557 earthquakes recorded since July 4, 2019 above Magnitude 2

M6.4 12km W of Searles Valley, CA
2019-07-04 17:33:49 (UTC)
51,000+ responses via Did You Feel It?

M7.1 18km W of Searles Valley, CA
2019-07-06 03:19:53 (UTC)
42,000+ responses via Did You Feel It?

3,557 earthquakes recorded since July 4, 2019 above Magnitude 2

M6.4 12km W of Searles Valley, CA
2019-07-04 17:33:49 (UTC)
51,000+ responses via Did You Feel It?

M7.1 18km W of Searles Valley, CA
2019-07-06 03:19:53 (UTC)
42,000+ responses via Did You Feel It?

Scientific equipment mounted on two yellow pontoons floating on the surface of green water under a blue sky
SQUID-5 - Structure-from-Motion Quantitative Underwater Imaging Device

The SQUID-5, or a Structure-from-Motion (SfM) Quantitative Underwater Imaging Device with 5 cameras is a towed surface vehicle with an onboard Global Navigation Satellite System (GNSS) and 5 downward-looking cameras with overlapping views of the seafloor.

The SQUID-5, or a Structure-from-Motion (SfM) Quantitative Underwater Imaging Device with 5 cameras is a towed surface vehicle with an onboard Global Navigation Satellite System (GNSS) and 5 downward-looking cameras with overlapping views of the seafloor.

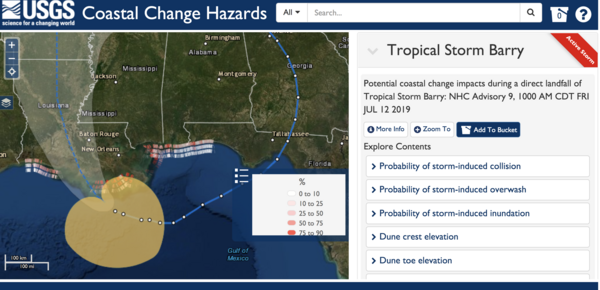
Forecasted Gulf Coast beach erosion due to Hurricane Barry
Barry's wave, surge likely to affect beaches in four states

This Coastal Change Storm Hazard Team map was created Friday, July 12, 2019 and shows forecast beach erosion (the strip of colored bars closest to the coast), overwash (middle strip) and inundation (outer strip) effects of Tropical Storm Barry’s predicted landfall in Louisiana.

This Coastal Change Storm Hazard Team map was created Friday, July 12, 2019 and shows forecast beach erosion (the strip of colored bars closest to the coast), overwash (middle strip) and inundation (outer strip) effects of Tropical Storm Barry’s predicted landfall in Louisiana.

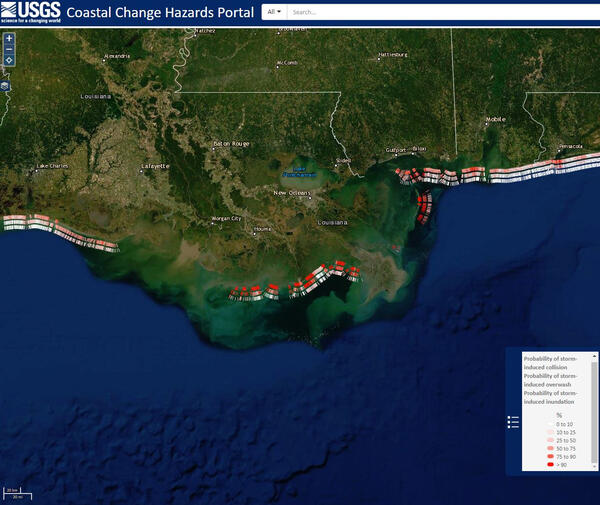
Baches forecast to be affected by Hurricane Barry
Barry's wave, surge likely to affect beaches in four states

This Coastal Change Storm Hazard Team map was created Friday, July 12, 2019 and shows forecast beach erosion (the strip of colored bars closest to the coast), overwash (middle strip) and inundation (outer strip) effects of Tropical Storm Barry’s predicted landfall in Louisiana.

This Coastal Change Storm Hazard Team map was created Friday, July 12, 2019 and shows forecast beach erosion (the strip of colored bars closest to the coast), overwash (middle strip) and inundation (outer strip) effects of Tropical Storm Barry’s predicted landfall in Louisiana.

Landfalling Barry's likely effects on Gulf beaches
Barry forecast to affect beaches in four Gulf states

This Coastal Change Storm Hazard Team map was created Thursday, July 11, 2019 and shows forecast beach erosion (the strip of colored bars closest to the coast), overwash (middle strip) and inundation (outer strip) effects of Tropical Storm Barry’s predicted landfall in Louisiana.

This Coastal Change Storm Hazard Team map was created Thursday, July 11, 2019 and shows forecast beach erosion (the strip of colored bars closest to the coast), overwash (middle strip) and inundation (outer strip) effects of Tropical Storm Barry’s predicted landfall in Louisiana.

Gulf beaches forecast to feel Barry's effects
These Gulf beaches are forecast to be affected by Barry

This Coastal Change Storm Hazard Team map was created Thursday, July 11, 2019 and shows forecast beach erosion (the strip of colored bars closest to the coast), overwash (middle strip) and inundation (outer strip) effects of Tropical Storm Barry’s predicted landfall in Louisiana.

This Coastal Change Storm Hazard Team map was created Thursday, July 11, 2019 and shows forecast beach erosion (the strip of colored bars closest to the coast), overwash (middle strip) and inundation (outer strip) effects of Tropical Storm Barry’s predicted landfall in Louisiana.

image related to volcanoes. See description
Sulfur deposits on Halema‘uma‘u crater walls

Group of sulfur-depositing fumaroles overlook the pond of water in Halema‘uma‘u. USGS photo by D. Swanson, 08-14-2019.

Group of sulfur-depositing fumaroles overlook the pond of water in Halema‘uma‘u. USGS photo by D. Swanson, 08-14-2019.

Portable Seismic Station

Two portable sensors: a strong motion sensor (to record strong shaking that can be felt) and a broadband sensor (to record weak motion for detecting small earthquakes) buried into the ground to detect earthquakes. These stations can be quickly deployed and send real-time data back to the USGS via cellular telemetry immediately after they are installed. 

Two portable sensors: a strong motion sensor (to record strong shaking that can be felt) and a broadband sensor (to record weak motion for detecting small earthquakes) buried into the ground to detect earthquakes. These stations can be quickly deployed and send real-time data back to the USGS via cellular telemetry immediately after they are installed. 

briefing navy
USGS provides briefing to Navy about Ridgecrest Earthquake Sequence

Kate Scharer (USGS) provides CO CAPT Paul Dale (Navy) with the field mapping team’s initial product, showing the surface fault rupture at NAWSCL as well as the temporarily deployed seismic and GPS sensors that were rapidly deployed. Contributions of field data from within the base were from CGS & USGS, and from outside the base were from Univ.

Kate Scharer (USGS) provides CO CAPT Paul Dale (Navy) with the field mapping team’s initial product, showing the surface fault rupture at NAWSCL as well as the temporarily deployed seismic and GPS sensors that were rapidly deployed. Contributions of field data from within the base were from CGS & USGS, and from outside the base were from Univ.

lidar truck
Scanning surface rupture from Searles Valley earthquake


USGS Earthquake Science Center Mobile Laser Scanning truck operated by Ben Brooks and Todd Ericksen scanning the surface rupture near the zone of maximum surface displacement of the M7.1 Searles Valley earthquake.


USGS Earthquake Science Center Mobile Laser Scanning truck operated by Ben Brooks and Todd Ericksen scanning the surface rupture near the zone of maximum surface displacement of the M7.1 Searles Valley earthquake.

rupture
Northern end of rupture resulting from the M7.1 Searles Valley quake

Fault rupture crosses dirt road, with California Geologial Survey vehicles for scale. Displacement at this location is primarily normal (vertical). Photograph taken near the northern end of the rupture resulting from the M7.1 Searles Valley earthquake.

Fault rupture crosses dirt road, with California Geologial Survey vehicles for scale. Displacement at this location is primarily normal (vertical). Photograph taken near the northern end of the rupture resulting from the M7.1 Searles Valley earthquake.

surface displacement
Measure surface displacement from Searles Valley quake #1

USGS Research Geologists Christopher DuRoss and Jessica Thompson Jobe examine rupture resulting from the M7.1 Searles Valley earthquake.

USGS Research Geologists Christopher DuRoss and Jessica Thompson Jobe examine rupture resulting from the M7.1 Searles Valley earthquake.

Surface faulting
Surface faulting from the M7.1 Searles Valley earthquake

Oblique photograph showing surface faulting from the M7.1 Searles Valley earthquake. The dirt track (center) is right-laterally offset approximately 2.5 m (~8 ft).

Oblique photograph showing surface faulting from the M7.1 Searles Valley earthquake. The dirt track (center) is right-laterally offset approximately 2.5 m (~8 ft).

Measure surface displacement from Searles Valley quake #2

USGS Research Geologists Christopher DuRoss measures surface displacement resulting from the M7.1 Searles Valley earthquake.

USGS Research Geologists Christopher DuRoss measures surface displacement resulting from the M7.1 Searles Valley earthquake.

access road offset
Helicopter Overflight Viewing Access Road Fault Offset

California Geological Survey and USGS geologists and geophysicists with National Guard and Navy personnel view road damage from 3 to 5 feet of right-lateral motion near the expected maximum slip locality along the primary tectonic rupture associated with the M 7.1 event.

California Geological Survey and USGS geologists and geophysicists with National Guard and Navy personnel view road damage from 3 to 5 feet of right-lateral motion near the expected maximum slip locality along the primary tectonic rupture associated with the M 7.1 event.

fault scarp
Inspecting the Vertical Offset Fault Scarp

Scientists from USGS & California Geological Survey viewing vertical fault offset of ~12 +/- 3 foot high fault scarp near the expected maximum slip locality along the primary tectonic rupture associated with the M 7.1 event.

Scientists from USGS & California Geological Survey viewing vertical fault offset of ~12 +/- 3 foot high fault scarp near the expected maximum slip locality along the primary tectonic rupture associated with the M 7.1 event.

fault rupture
Searles Valley Earthquake field photo #1

USGS Geologists Beth Haddon and Josie Nevitt measure fault displacement along the principal rupture.

USGS Geologists Beth Haddon and Josie Nevitt measure fault displacement along the principal rupture.

fault rupture
Searles Valley Earthquake field photo #2

USGS geologists Josie Nevitt and Beth Haddon make measurements of fault rupture.

fault rupture
Searles Valley Earthquake field photo #3

USGS Geophysicists Elizabeth Cochran and Nick VanDerElst install a seismometer on the base.

fault rupture
Searles Valley Earthquake field photo #4

USGS geodesist Todd Ericksen sets up GPS surveying equipment on July 5th.