
The water level at Kīlauea summit continues to slowly rise, with the size of the pond gradually enlarging. The pond today was at least 140 m (460 ft) in the east-west direction (from bottom to top of image). This length is a minimum estimate as the west end of the pond is now partially blocked from view by the crater walls. USGS photo by D. Swanson.
Images
Images intro.
Filter Total Items: 7146

Continued slow rise of water level at bottom of Halema‘uma‘u
The water level at Kīlauea summit continues to slowly rise, with the size of the pond gradually enlarging. The pond today was at least 140 m (460 ft) in the east-west direction (from bottom to top of image). This length is a minimum estimate as the west end of the pond is now partially blocked from view by the crater walls. USGS photo by D. Swanson.

Environmental Geoscience Fieldwork
Environmental geoscience fieldwork
Environmental geoscience fieldwork
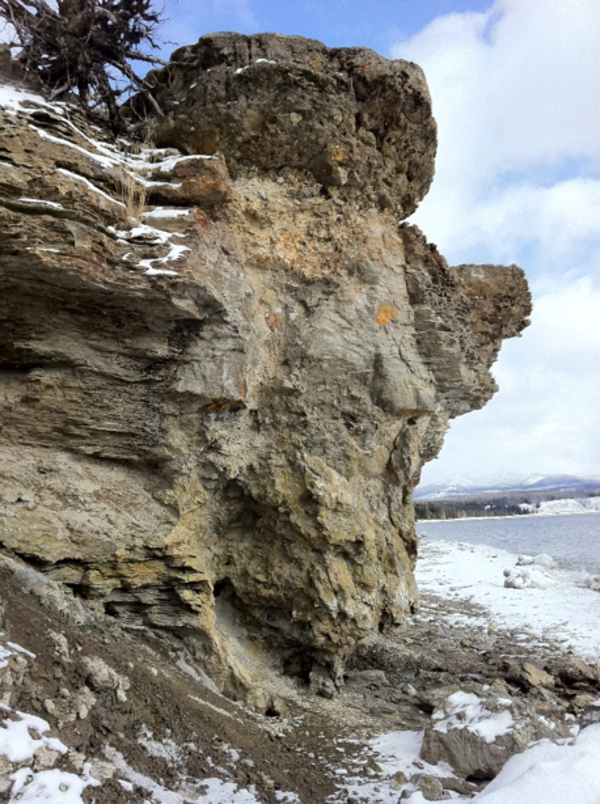
Black Dog breccia pipe is the remnant of an inactive hydrothermal vent system fo
Black Dog breccia pipe is the remnant of an inactive hydrothermal vent system fo
Black Dog breccia pipe is the remnant of an inactive hydrothermal vent system fo

A closer look at the water surface. While most of the surface has a yellow-gree
A closer look at the water surface. While most of the surface has a yellow-green color, portions along the shoreline have a blue color and seem to correspond to areas of water upwelling. USGS photo by M. Patrick.
A closer look at the water surface. While most of the surface has a yellow-green color, portions along the shoreline have a blue color and seem to correspond to areas of water upwelling. USGS photo by M. Patrick.

Breccia pipes forming within existing fractures along the western shore of Yello
Material filling the dissolved voids includes clasts of wall rock as well as beach sediments being washed into the voids. The lower structure on the left is about 0.7 m (2 ft) wide and 1.5 m (5 ft) high. Note the fracture alignment above the void structure on the right.
Material filling the dissolved voids includes clasts of wall rock as well as beach sediments being washed into the voids. The lower structure on the left is about 0.7 m (2 ft) wide and 1.5 m (5 ft) high. Note the fracture alignment above the void structure on the right.

USGS PCMSC UAS
An remotely piloted aircraft (RPA) or drone, equipped with a camera, sits on the Arctic tundra awaiting a radio signal that tells it to fly.
An remotely piloted aircraft (RPA) or drone, equipped with a camera, sits on the Arctic tundra awaiting a radio signal that tells it to fly.

Low-oblique view of Barter Island bluffs
Example of a low-oblique photograph taken with an unmanned aerial system (UAS), or drone, of the coastal bluffs of Barter Island on North Slope of Alaska. The photographs from different time periods can be compared, using a technique called structure-from-motion photogrammetry, to measure changes in the coastal bluffs.
Example of a low-oblique photograph taken with an unmanned aerial system (UAS), or drone, of the coastal bluffs of Barter Island on North Slope of Alaska. The photographs from different time periods can be compared, using a technique called structure-from-motion photogrammetry, to measure changes in the coastal bluffs.

Thermal photograph of Barter Island bluffs
Example of a thermal photograph of Barter Island's bluffs, on the North Slope of Alaska. Two USGS scientists stand waving on the right side of the photo. Lighter areas are warmer, darker areas are colder. Thermal photography makes it easy to detect areas of permafrost, or the lack thereof.
Example of a thermal photograph of Barter Island's bluffs, on the North Slope of Alaska. Two USGS scientists stand waving on the right side of the photo. Lighter areas are warmer, darker areas are colder. Thermal photography makes it easy to detect areas of permafrost, or the lack thereof.

Oblique view of Barter Island bluffs
Example of a high-oblique photograph taken with an unmanned aerial system (UAS), or drone, of the coastal bluffs of Barter Island on North Slope of Alaska. The photographs from different time periods can be compared, using a technique called structure-from-motion photogrammetry, to measure changes in the coastal bluffs.
Example of a high-oblique photograph taken with an unmanned aerial system (UAS), or drone, of the coastal bluffs of Barter Island on North Slope of Alaska. The photographs from different time periods can be compared, using a technique called structure-from-motion photogrammetry, to measure changes in the coastal bluffs.

Alongshore view of Barter Island bluffs
Alongshore view of the Barter Island permafrost bluffs, along the north coast of Alaska in the Arctic Ocean.
Alongshore view of the Barter Island permafrost bluffs, along the north coast of Alaska in the Arctic Ocean.

Drainage gully in coastal bluffs of Barter Island
Along the stretch of coastal bluffs of Barter Island, North Slope of Alaska, a new drainage gully developed between September 2018 and September 2019. USGS scientists have been measuring permafrost degradation, coastal erosion, and flooding hazards on and around Barter Island for the last decade.
Along the stretch of coastal bluffs of Barter Island, North Slope of Alaska, a new drainage gully developed between September 2018 and September 2019. USGS scientists have been measuring permafrost degradation, coastal erosion, and flooding hazards on and around Barter Island for the last decade.

Coastal bluffs collapsed onto the beach
Gigantic chunks of perafrost coastal bluffs tumbled down onto the beach along Barter Island on the North Slope of Alaska. A USGS scientist drives past them, seeking good locations to place instruments and markers that will be used in photographic analysis.
Gigantic chunks of perafrost coastal bluffs tumbled down onto the beach along Barter Island on the North Slope of Alaska. A USGS scientist drives past them, seeking good locations to place instruments and markers that will be used in photographic analysis.

Large blocks of failed coastal bluff on Barter Island
Large blocks of coastal bluff tumble down onto the beach of Barter Island, on the North Slope of Alaska.
Large blocks of coastal bluff tumble down onto the beach of Barter Island, on the North Slope of Alaska.

Seismic sled used for sub-bottom surveying
USGS scientist Chelsea Stalk stands on a floating sled that enables sub‐bottom surveying in shallow water, nearshore, and shore‐face environments. The sled is equipped with an EdgeTech SB‐512i CHIRP system and single‐beam sonar. This equipment is used to collect seismic sub‐bottom profiles and single‐beam bathymetry.
USGS scientist Chelsea Stalk stands on a floating sled that enables sub‐bottom surveying in shallow water, nearshore, and shore‐face environments. The sled is equipped with an EdgeTech SB‐512i CHIRP system and single‐beam sonar. This equipment is used to collect seismic sub‐bottom profiles and single‐beam bathymetry.

Video of circulation in the Halema‘uma‘u water pond
This timelapse video covers about 25 minutes and shows the circulation in the water pond in Halema‘uma‘u. There appears to be an influx of water along the southern shoreline (right side in this image). A broader eastward flow of water (towards the top of the image) is evident. The video is shown twice.
This timelapse video covers about 25 minutes and shows the circulation in the water pond in Halema‘uma‘u. There appears to be an influx of water along the southern shoreline (right side in this image). A broader eastward flow of water (towards the top of the image) is evident. The video is shown twice.

Another timelapse view of the summit water pond
This timelapse video covers about 30 minutes of activity at the water pond in Halema‘uma‘u at the summit of Kīlauea. Water appears to be flowing into the pond from several locations, including the southern boundary (right side in this image). A small amount of material is also seen floating on the surface at the eastern end of the pond (top of image).
This timelapse video covers about 30 minutes of activity at the water pond in Halema‘uma‘u at the summit of Kīlauea. Water appears to be flowing into the pond from several locations, including the southern boundary (right side in this image). A small amount of material is also seen floating on the surface at the eastern end of the pond (top of image).

HVO measures water table at Keller Well
HVO field engineers and staff conducted quarterly work at a deep borehole, known as the Keller Well, at the summit of Kīlauea Volcano today (Sept. 24). They lowered a sensor into the well to measure the distance between the ground surface and the top of the water table, which was 505 m (1657 ft) below the ground surface today.
HVO field engineers and staff conducted quarterly work at a deep borehole, known as the Keller Well, at the summit of Kīlauea Volcano today (Sept. 24). They lowered a sensor into the well to measure the distance between the ground surface and the top of the water table, which was 505 m (1657 ft) below the ground surface today.

Scott Lydeen on Strawberry Peak Seismic Station Tower
USGS technicial Scott Lydeen climbing the tower at the Strawberry Peak seismic station tower, part of the Southern California Seismic Network.
USGS technicial Scott Lydeen climbing the tower at the Strawberry Peak seismic station tower, part of the Southern California Seismic Network.

This video is shown at 30x speed and highlights the changing activity on the sur
This video is shown at 30x speed and highlights the changing activity on the surface of the water pond. Steaming shifts in the wind, and circulation of the water is evident in areas of sharp color boundaries.
This video is shown at 30x speed and highlights the changing activity on the surface of the water pond. Steaming shifts in the wind, and circulation of the water is evident in areas of sharp color boundaries.

Images taken on September 10 and 14 show the slight rise in water level, most ob
Images taken on September 10 and 14 show the slight rise in water level, most obvious by comparing the rock marked with an arrow in each photo. USGS photos by M. Patrick.
Images taken on September 10 and 14 show the slight rise in water level, most obvious by comparing the rock marked with an arrow in each photo. USGS photos by M. Patrick.

Mauna Loa: Early morning view of Moku‘āweoweo
An early morning view looking north across Moku‘āweoweo, Mauna Loa's summit caldera, from a spot near the summit cabin on the volcano's south caldera rim. Frost covered much of the caldera floor that was still shadowed, and weak steaming issued from the usual areas. Overall, there were no significant changes observed at the summit.
An early morning view looking north across Moku‘āweoweo, Mauna Loa's summit caldera, from a spot near the summit cabin on the volcano's south caldera rim. Frost covered much of the caldera floor that was still shadowed, and weak steaming issued from the usual areas. Overall, there were no significant changes observed at the summit.