Rigorously Valuing the Role of the U.S. Virgin Islands’ Coral Reefs in Coastal Hazard Risk Reduction
Estimated Annual Benefits

Official websites use .gov
A .gov website belongs to an official government organization in the United States.
Secure .gov websites use HTTPS
A lock () or https:// means you’ve safely connected to the .gov website. Share sensitive information only on official, secure websites.

Rigorously Valuing the Role of the U.S. Virgin Islands’ Coral Reefs in Coastal Hazard Risk Reduction
Estimated Annual Benefits
Rigorously Valuing the Role of the U.S. Virgin Islands’ Coral Reefs in Coastal Hazard Risk Reduction
Estimated Annual Benefits

Rigorously Valuing the Role of Puerto Rico’s Coral Reefs in Coastal Hazard Risk Reduction
Estimated Annual Benefits
Rigorously Valuing the Role of Puerto Rico’s Coral Reefs in Coastal Hazard Risk Reduction
Estimated Annual Benefits

A typical section of shoreline in the Kapoho area, formed by thick toothpaste lava that originated from Fissure 8 during the 2018 eruption. USGS photo by M. Zoeller.
A typical section of shoreline in the Kapoho area, formed by thick toothpaste lava that originated from Fissure 8 during the 2018 eruption. USGS photo by M. Zoeller.

Field observations today show that the diameters of the crater lake within Halema‘uma‘u at the summit of Kīlauea are about 94 m (308 ft) north-south and around 192-195 m (630-640 ft) east-west. Too much steam at the west end interfered with measurements this morning.
Field observations today show that the diameters of the crater lake within Halema‘uma‘u at the summit of Kīlauea are about 94 m (308 ft) north-south and around 192-195 m (630-640 ft) east-west. Too much steam at the west end interfered with measurements this morning.

On January 17, 2020, USGS-HVO scientists and DOI Unoccupied Aerial System (UAS) team members collected three additional samples of water from the Halema‘uma‘u crater lake. Here, the sampling device and temperature logger were readied for takeoff. The plastic sleeve was attached to the UAS (drone) with a cord about 20 feet (6 m) long.
On January 17, 2020, USGS-HVO scientists and DOI Unoccupied Aerial System (UAS) team members collected three additional samples of water from the Halema‘uma‘u crater lake. Here, the sampling device and temperature logger were readied for takeoff. The plastic sleeve was attached to the UAS (drone) with a cord about 20 feet (6 m) long.

Schematic diagram of the magmatic system underneath Yellowstone caldera and the processes leading to a "shadow zone".
Schematic diagram of the magmatic system underneath Yellowstone caldera and the processes leading to a "shadow zone".

GeoGirls Geology and Technology Field Camp 2020
GeoGirls Geology and Technology Field Camp 2020

Cascades Volcano Observatory Open House May 9, 2020
Cascades Volcano Observatory Open House May 9, 2020

USGS scientists Nicholas van der Elst and Alan Yong installing a seismometer near the 2019 Ridgecrest earthquakes in southern California in order to record its aftershocks.
USGS scientists Nicholas van der Elst and Alan Yong installing a seismometer near the 2019 Ridgecrest earthquakes in southern California in order to record its aftershocks.

USGS technician Jennifer O’Keefe Suttles stands within a Phragmites stand within the Herring River Estuary, part of the Cape Cod National Seashore.
USGS technician Jennifer O’Keefe Suttles stands within a Phragmites stand within the Herring River Estuary, part of the Cape Cod National Seashore.

Woods Hole Coastal and Marine Science Center geologist, Ben Gutierrez, moderates a panel at the 2019 Partnership Eucation Program (PEP) 10th Anniversity Conference and Celebration, Woods Hole, MA June 28-30, 2019.
Woods Hole Coastal and Marine Science Center geologist, Ben Gutierrez, moderates a panel at the 2019 Partnership Eucation Program (PEP) 10th Anniversity Conference and Celebration, Woods Hole, MA June 28-30, 2019.

Woods Hole Coastal and Marine Science Center geologist, Ben Gutierrez, moderates a panel with PEP coordinators, Jonique Howard, Onjale Scott Price, and Adrienne George, at the 2019 Partnership Eucation Program (PEP) 10th Anniversity Conference and Celebration, Woods Hole, MA June 28-30, 2019.
Woods Hole Coastal and Marine Science Center geologist, Ben Gutierrez, moderates a panel with PEP coordinators, Jonique Howard, Onjale Scott Price, and Adrienne George, at the 2019 Partnership Eucation Program (PEP) 10th Anniversity Conference and Celebration, Woods Hole, MA June 28-30, 2019.

High ice content permafrost bluff erosion at Barter Island in 2019 after several coastal storms and a prolonged time of anomalously high air temperatures.
High ice content permafrost bluff erosion at Barter Island in 2019 after several coastal storms and a prolonged time of anomalously high air temperatures.

Delaware River

This photo looks north along the broad Fissure 8 channel. At its widest section, the Fissure 8 channel is about 430 meters (1400 feet wide). In the upper right section of the photo, Highway 132 can be seen cutting through the braided section of the channel. USGS photo by M. Zoeller.
This photo looks north along the broad Fissure 8 channel. At its widest section, the Fissure 8 channel is about 430 meters (1400 feet wide). In the upper right section of the photo, Highway 132 can be seen cutting through the braided section of the channel. USGS photo by M. Zoeller.

A closer view of the braided section of the Fissure 8 channel, with Highway 132 cutting across both branches. USGS photo by M. Zoeller.
A closer view of the braided section of the Fissure 8 channel, with Highway 132 cutting across both branches. USGS photo by M. Zoeller.

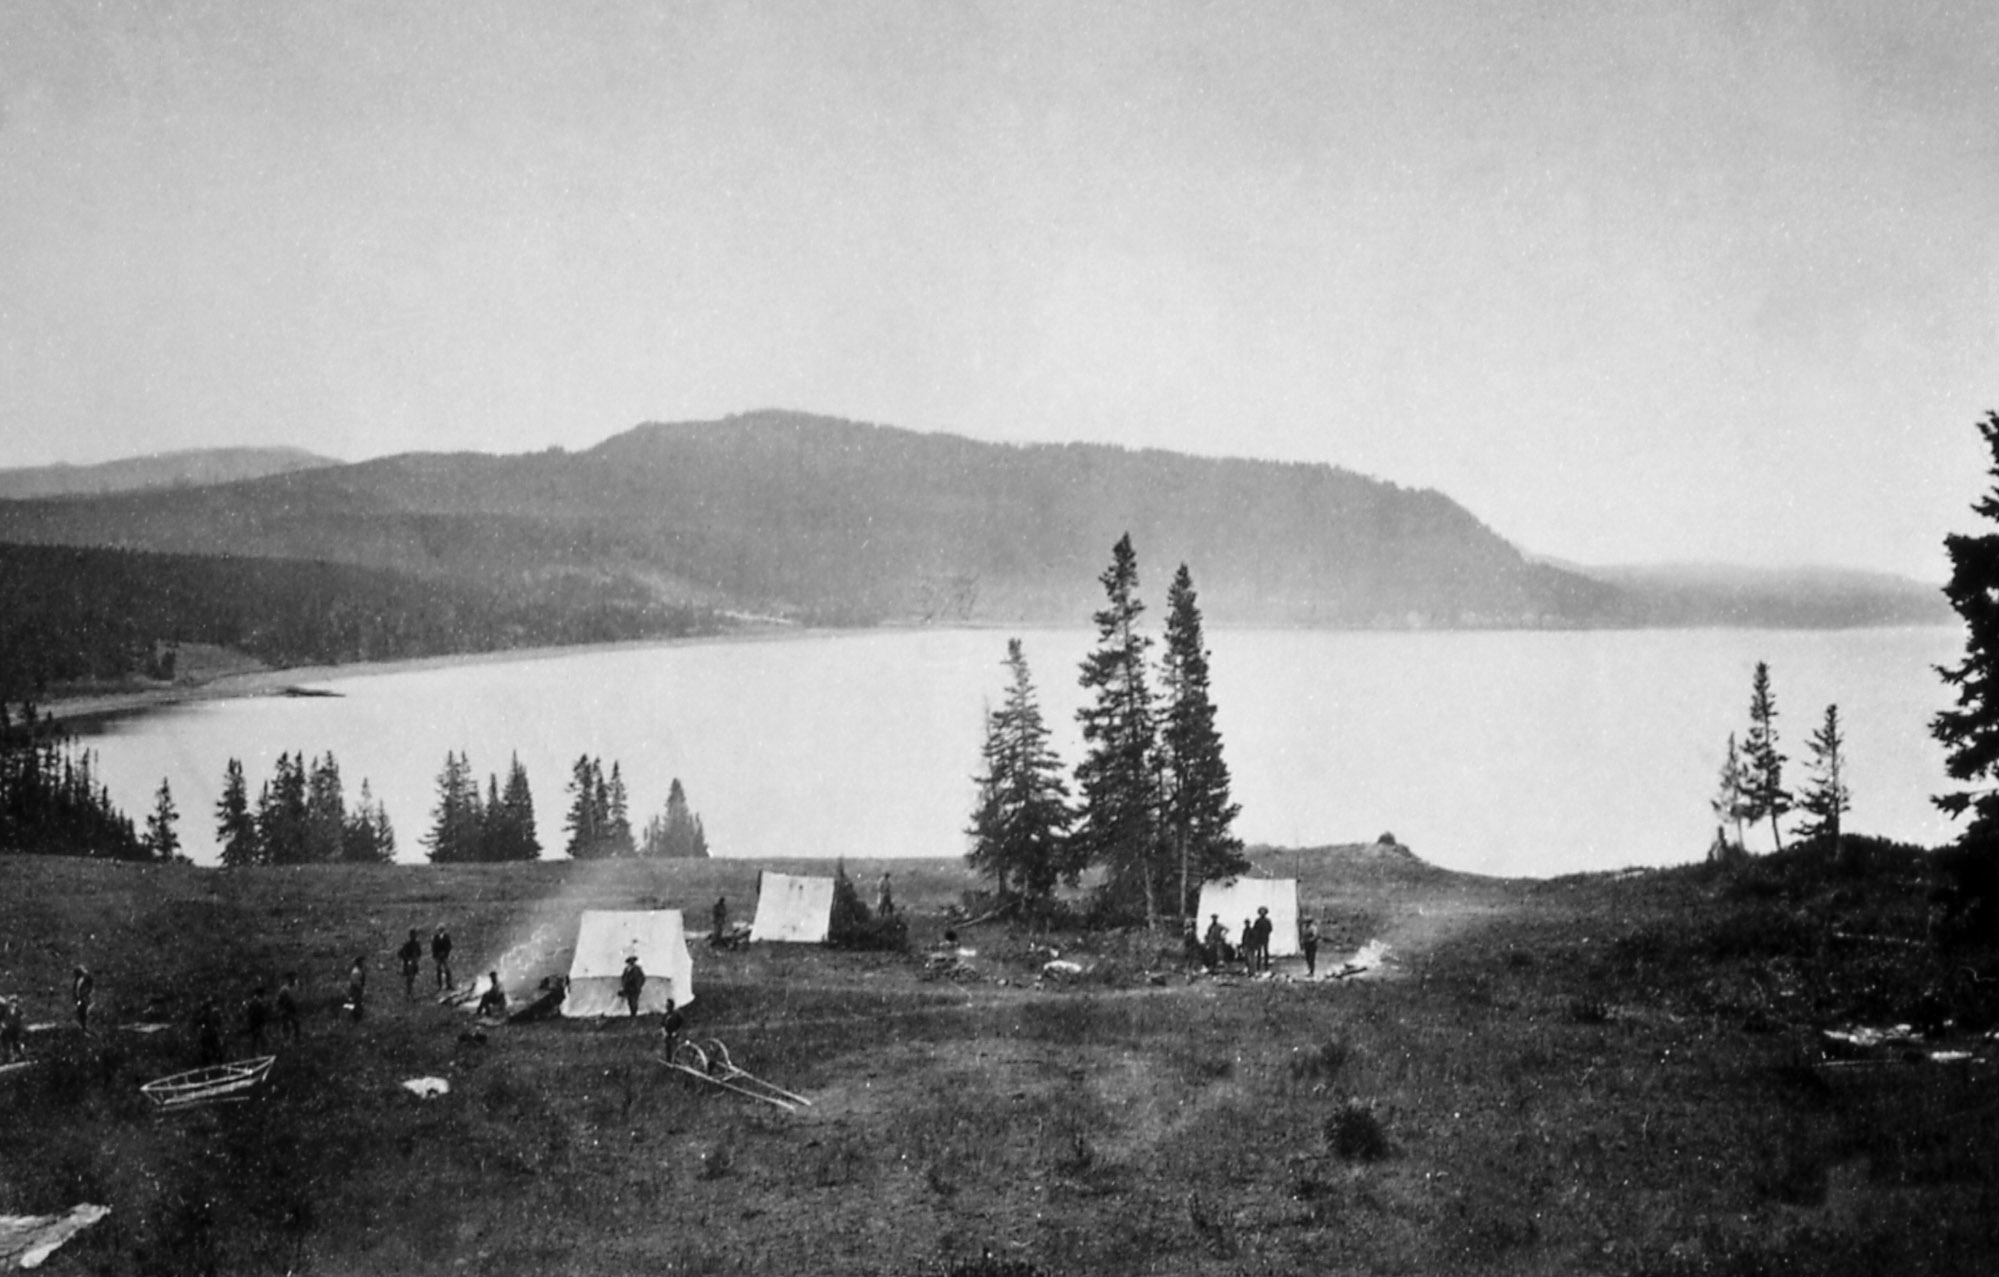
"Earthquake camp" of the Hayden expedition in 1871, located on the north shore of Yellowstone Lake near Steamboat Point. Photo by William H. Jackson, courtesy Yellowstone National Park (https://www.nps.gov/features/yell/slidefile/history/jacksonphotos/Image…).
"Earthquake camp" of the Hayden expedition in 1871, located on the north shore of Yellowstone Lake near Steamboat Point. Photo by William H. Jackson, courtesy Yellowstone National Park (https://www.nps.gov/features/yell/slidefile/history/jacksonphotos/Image…).

Earthquake hazard map showing peak ground accelerations having a 2 percent probability of being exceeded in 50 years, for a firm rock site. Black box outlines Yellowstone region. The map is based on the most recent USGS models for the conterminous U.S. (2018), Hawaii (1998), and Alaska (2007).
Earthquake hazard map showing peak ground accelerations having a 2 percent probability of being exceeded in 50 years, for a firm rock site. Black box outlines Yellowstone region. The map is based on the most recent USGS models for the conterminous U.S. (2018), Hawaii (1998), and Alaska (2007).

Yellowstone earthquakes that occurred during 2010-2019. Blue symbols indicate events that occurred as part of swarms, while red indicates non-swarm seismicity. Map courtesy of the University of Utah Seismograph Stations.
Yellowstone earthquakes that occurred during 2010-2019. Blue symbols indicate events that occurred as part of swarms, while red indicates non-swarm seismicity. Map courtesy of the University of Utah Seismograph Stations.

Mount Konocti as seen from the town of Clear Lake.
Mount Konocti as seen from the town of Clear Lake.

Thurston Lake and Mount Konocti, Clear Lake Volcanic Field, California.
Thurston Lake and Mount Konocti, Clear Lake Volcanic Field, California.