
State and Federal officials joined partners involved in the Herring River Restoration Project for a group photo at the groundbreaking event at Chequessett Neck bridge in Wellfleet, Massachusetts.
Images
Images intro.
Filter Total Items: 2135
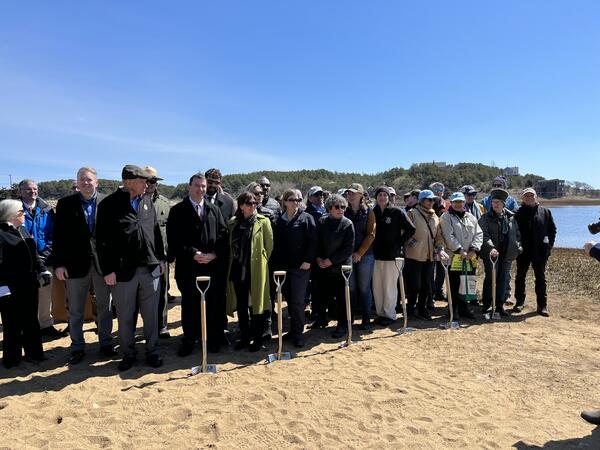
Herring River Restoration Project Groundbreaking Event
State and Federal officials joined partners involved in the Herring River Restoration Project for a group photo at the groundbreaking event at Chequessett Neck bridge in Wellfleet, Massachusetts.

Herring River Restoration Project Groundbreaking Event
The USGS celebrating the groundbreaking of the Herring River restoration!
The USGS celebrating the groundbreaking of the Herring River restoration!

Herring River Restoration Project Groundbreaking Event
The USGS attendees of the Herring River Restoration Project groundbreaking event standing proudly next to a sign detailing the project.
The USGS attendees of the Herring River Restoration Project groundbreaking event standing proudly next to a sign detailing the project.

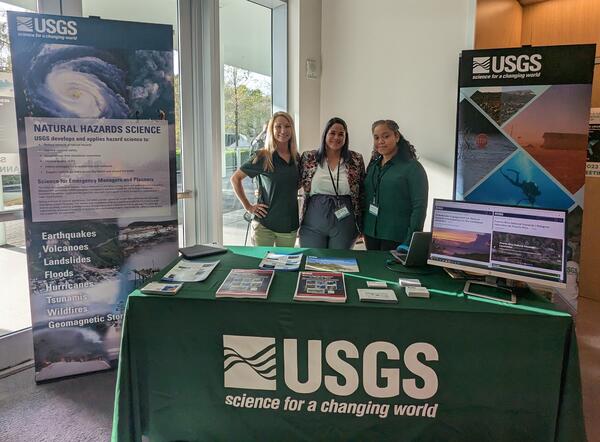
Herring River Restoration Project Groundbreaking Event
Rob Thieler, Meagan Eagle, and Sophie Kuhl of the U.S. Geological Survey, Woods Hole Coastal and Marine Science Center posing with the “Salt Marshes: A Carbon Bank in Our Backyard” sign near the Herring River.
Rob Thieler, Meagan Eagle, and Sophie Kuhl of the U.S. Geological Survey, Woods Hole Coastal and Marine Science Center posing with the “Salt Marshes: A Carbon Bank in Our Backyard” sign near the Herring River.

Aerial image of rocky shoreline along Central California coast
Aerial image of rocky shoreline at Garrapata State Park, along the Central California coast.
Aerial image of rocky shoreline at Garrapata State Park, along the Central California coast.
USGS staff engage with stakeholders and explore potential partnerships at SCDRP annual meeting
Meaghan Emory and Drs. Legna Torres-Garcia and Donya Frank-Gilchrist engage with stakeholders and explore potential partnerships across Caribbean nations and territories to further enhance USGS natural hazards research at the 2023 SCDRP annual meeting in Miami, Florida.
Meaghan Emory and Drs. Legna Torres-Garcia and Donya Frank-Gilchrist engage with stakeholders and explore potential partnerships across Caribbean nations and territories to further enhance USGS natural hazards research at the 2023 SCDRP annual meeting in Miami, Florida.

Coring in the Marsh
USGS scientists collect core samples from marsh to explore the drives of wetland accretion in the face of rising seas and human impacts impact the evolution on salt marshes.
USGS scientists collect core samples from marsh to explore the drives of wetland accretion in the face of rising seas and human impacts impact the evolution on salt marshes.

Marsh in Wellfleet, MA
USGS scientists collect core samples from marsh to explore the drives of wetland accretion in the face of rising seas and human impacts impact the evolution on salt marshes.
USGS scientists collect core samples from marsh to explore the drives of wetland accretion in the face of rising seas and human impacts impact the evolution on salt marshes.

2022 Coring
As sea levels rise, salt water extends further up tidal rivers. As sea-level rise accelerates, vegetation transitions are increasingly observed and USGS scientists are busy assessing those changes. USGS scientists take soil cores in the marsh.
As sea levels rise, salt water extends further up tidal rivers. As sea-level rise accelerates, vegetation transitions are increasingly observed and USGS scientists are busy assessing those changes. USGS scientists take soil cores in the marsh.

A collage of images depicts shoreline habitat and wildlife that use the Salton Sea area
A collage of images depicts shoreline habitat and wildlife that use the Salton Sea area in southern California.
A collage of images depicts shoreline habitat and wildlife that use the Salton Sea area in southern California.

Video footage of USGS Research Geologist Patrick Barnard in the field
Video footage of USGS Research Geologist Patrick Barnard in the field, from the short film "Our Beautiful Planet - Saving Our Shores"
Video footage of USGS Research Geologist Patrick Barnard in the field, from the short film "Our Beautiful Planet - Saving Our Shores"

Polar bear walking along Beaufort Sea coast
A polar bear walking along the Beaufort Sea coast with storm waves breaking behind it, filmed during fieldwork at Barter Island, Alaska.
A polar bear walking along the Beaufort Sea coast with storm waves breaking behind it, filmed during fieldwork at Barter Island, Alaska.

Coastal Change From New Sediment
A photo collage shows examples of coastal changes at the mouths of small rivers of the world resulting from contributions of new sediment. Imagery from Google Earth.
A photo collage shows examples of coastal changes at the mouths of small rivers of the world resulting from contributions of new sediment. Imagery from Google Earth.

Donya Frank-Gilchrist explains coastal erosion for Great American Teach-In
Research Physical Scientist Donya Frank-Gilchrist visited three classes at Lakeview Fundamental Elementary School for the 2022 Great American Teach-In to discuss wave dynamics, extreme storms, and how these processes alter coastal ecosystems.
Research Physical Scientist Donya Frank-Gilchrist visited three classes at Lakeview Fundamental Elementary School for the 2022 Great American Teach-In to discuss wave dynamics, extreme storms, and how these processes alter coastal ecosystems.

Photo of a passive-sampling semipermeable membrane device deployed on a coral reef in West Maui, Hawai'i
linkPhoto of a passive-sampling semipermeable membrane device deployed on a coral reef in West Maui, Hawai'i, to detect organic compounds carried by groundwater discharge.
Photo of a passive-sampling semipermeable membrane device deployed on a coral reef in West Maui, Hawai'i
linkPhoto of a passive-sampling semipermeable membrane device deployed on a coral reef in West Maui, Hawai'i, to detect organic compounds carried by groundwater discharge.

A map showing study sites at West Maui, Hawai'i, where passive samplers were deployed to detect groundwater contaminants
linkA map showing study sites at West Maui, Hawai'i, where passive samplers were deployed to detect groundwater contaminants such as pesticides, pharmaceutical compounds, and personal care products that can harm coral reefs.

Geomorphically diverse settings that are experiencing climate-change impacts or are expected to in the coming decades
linkGeomorphically diverse settings that are experiencing climate-change impacts or are expected to in the coming decades (from upper left to lower right: eroding permafrost coast, river channel, drylands, cryosphere, steep hillslopes, and a recently burned region; photographs by U.S. Geological Survey).

An animation showing tectonic faults across the Eastern Pacific Ocean from space, including the Queen Charlotte-Fairweather fault
linkAn animation showing tectonic faults across the Eastern Pacific Ocean from space. The San Andreas fault in California is shown in green, and the Cascadia Subduction Zone north of it is shown in yellow. The animation ends at the location of Queen Charlotte-Fairweather fault (in yellow), displaying the latest 30-meter terrain model.

A computed-generated image showing the Queen Charlotte Fault and nearshore area, using bathymetry and lidar data
linkA computed-generated image showing the bathymetry of the Queen Charlotte Fault and the elevation of mountains in the nearshore area, using bathymetry and lidar data.
A computed-generated image showing the Queen Charlotte Fault and nearshore area, using bathymetry and lidar data
linkA computed-generated image showing the bathymetry of the Queen Charlotte Fault and the elevation of mountains in the nearshore area, using bathymetry and lidar data.

Map of U.S. Coastlines
Our Nation’s coastlines are almost 100,000 miles long. These extensive coastal areas stretch from Maine’s Atlantic shores in the northeast, south along the shores of the Gulf of Mexico and insular areas in the Caribbean.
Our Nation’s coastlines are almost 100,000 miles long. These extensive coastal areas stretch from Maine’s Atlantic shores in the northeast, south along the shores of the Gulf of Mexico and insular areas in the Caribbean.

A diagram that compares hand-digitization versus human-in-the-loop image segmentation
A diagram that compares hand-digitization versus human-in-the-loop image segmentation workflows. The image (a) is the first in data set F, captured by Landsat 8 on 15 February 2015. The hand-drawn polygons (b) are rasterized to create a label image (c). Subplots (d) and (e) show details from the two regions identified in (c).
A diagram that compares hand-digitization versus human-in-the-loop image segmentation workflows. The image (a) is the first in data set F, captured by Landsat 8 on 15 February 2015. The hand-drawn polygons (b) are rasterized to create a label image (c). Subplots (d) and (e) show details from the two regions identified in (c).