
Infographic about critical mineral commodities use in renewable energy, published online by the USGS Office of Communications and Publishing in June 2019.
Images
Mineral Resources Program images.
Filter Total Items: 242

Critical.Mineral.Commodities.in_.Renewable.Energy.jpg
Infographic about critical mineral commodities use in renewable energy, published online by the USGS Office of Communications and Publishing in June 2019.

3d geophysical map of the Idaho Cobalt Belt
This image shows a 3d visualization of geophysical data collected over the Idaho Cobalt Belt by the Earth Mapping Resources Initiative (Earth MRI).
This image shows a 3d visualization of geophysical data collected over the Idaho Cobalt Belt by the Earth Mapping Resources Initiative (Earth MRI).
Mineral Systems Map Green
This map shows, in green, areas that are part of Mineral Systems identified by the USGS. These mineral systems are used to create focus areas for mapping through the Earth Mapping Resources Initiative (Earth MRI).
This map shows, in green, areas that are part of Mineral Systems identified by the USGS. These mineral systems are used to create focus areas for mapping through the Earth Mapping Resources Initiative (Earth MRI).

Figure4SeismicCopper.png
World map of expected annual disruption of copper refinery production, in metric tons, from potential seismic activity.
World map of expected annual disruption of copper refinery production, in metric tons, from potential seismic activity.
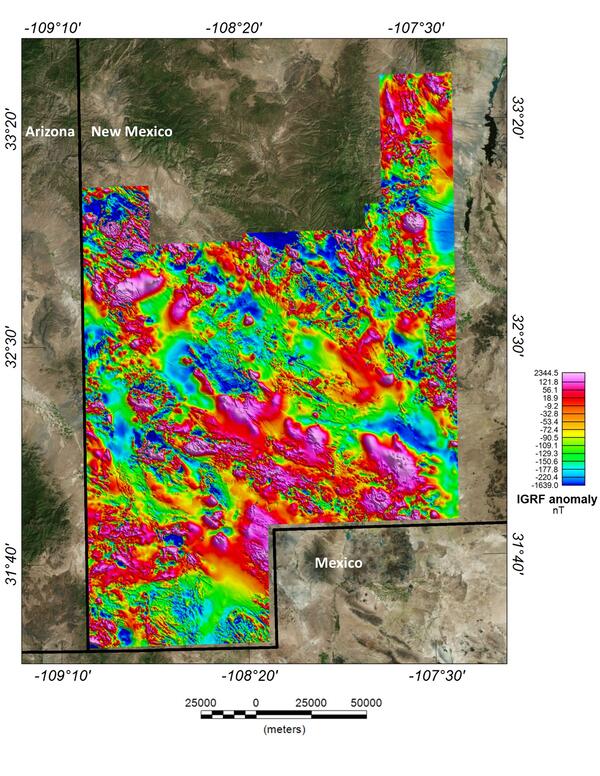
New Mexico porphyry copper belt aeromagnetic survey magnetic anomaly data
This image depicts the magnetic anomaly map of the region covered by the Southwest New Mexico aeromagnetic/aeroradiometric survey. These data allow us to model the subsurface structure and composition of the upper crust.
This image depicts the magnetic anomaly map of the region covered by the Southwest New Mexico aeromagnetic/aeroradiometric survey. These data allow us to model the subsurface structure and composition of the upper crust.

USGS critical mineral supply chain infographic
Infographic on USGS critical mineral supply chain analysis.
Minerals are essential to power homes and businesses and to manufacture products and technologies, from phones to vehicles.
Infographic on USGS critical mineral supply chain analysis.
Minerals are essential to power homes and businesses and to manufacture products and technologies, from phones to vehicles.

Areas with potential for key critical minerals in microchips
Map of areas with potential for key critical minerals in microchips.
Map of areas with potential for key critical minerals in microchips.

Areas with potential for key critical minerals in high-capacity batteries
Map of areas with potential for key critical minerals in high capacity batteries.
Map of areas with potential for key critical minerals in high capacity batteries.

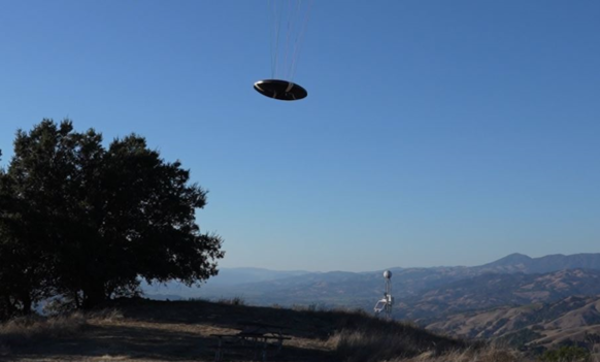
Saucer Shark Aeroshell and payload suspended by sling
USGS National Innovation Center UAS Research Center Saucer Shark Project, before science flight tests, Aeroshell and payload. Sling configuration and payload orientation verified before science flight deployment. Payload is on and ready to record!
USGS National Innovation Center UAS Research Center Saucer Shark Project, before science flight tests, Aeroshell and payload. Sling configuration and payload orientation verified before science flight deployment. Payload is on and ready to record!

BisonCore (MagEdition) displays live magnetic data (top) and lidar altitude (bottom)
USGS National Innovation Center UAS Research Center Saucer Shark Project, BisonCore displays the path of the sensor live, as it covers transects. Data received from the payload is then displayed within the BisonCore Ecosystem and is accessible for field viewing. The magnetic map is also used to validate payload directed algorithms.
USGS National Innovation Center UAS Research Center Saucer Shark Project, BisonCore displays the path of the sensor live, as it covers transects. Data received from the payload is then displayed within the BisonCore Ecosystem and is accessible for field viewing. The magnetic map is also used to validate payload directed algorithms.
Flying Saucer Shark Deployed over the skies of California
USGS National Innovation Center UAS Research Center Saucer Shark Project, during flight tests, aeroshell. Saucer Shark on landing approach after completed mission. Just above the landing pad.
USGS National Innovation Center UAS Research Center Saucer Shark Project, during flight tests, aeroshell. Saucer Shark on landing approach after completed mission. Just above the landing pad.

Saucer Shark Drop Release during testing campaign
USGS National Innovation Center UAS Research Center Saucer Shark Project, during flight tests, drop release attached to USGS UAV. Aircraft sits on landing pad in-between test flights.
USGS National Innovation Center UAS Research Center Saucer Shark Project, during flight tests, drop release attached to USGS UAV. Aircraft sits on landing pad in-between test flights.

Saucer Shark Deployed Below UAV
USGS National Innovation Center UAS Research Center (UASRC) Saucer Shark Project, during flight tests, fully assembled. Sub assemblies from top down: Drop Release, Sling and Sling Brace, Payload Aeroshell and Payload.
USGS National Innovation Center UAS Research Center (UASRC) Saucer Shark Project, during flight tests, fully assembled. Sub assemblies from top down: Drop Release, Sling and Sling Brace, Payload Aeroshell and Payload.

MRP USB VID
Mineral Resources Program (MRP) Digital Copy of Publications and Websites list USB with USGS VID.
Mineral Resources Program (MRP) Digital Copy of Publications and Websites list USB with USGS VID.
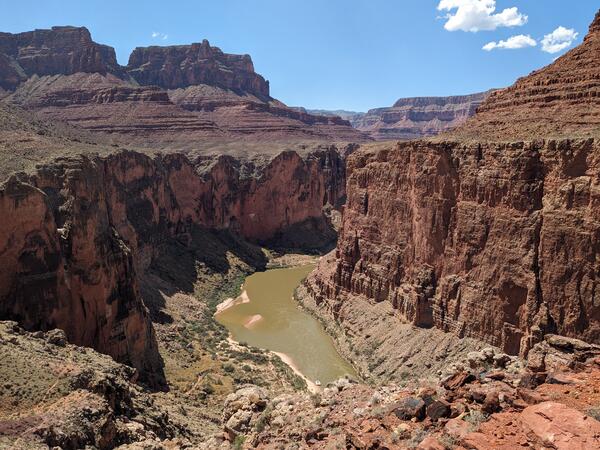
Grand_Canyon_20230908_Brennan.jpg
Photograph of the Colorado River in the Grand Canyon, Arizona, USA. Photo taken on September 8, 2023.
By
Core Science Systems Mission Area, Natural Hazards Mission Area, Water Resources Mission Area, Mineral Resources Program, National Cooperative Geologic Mapping Program, National Water Quality Program, Toxic Substances Hydrology, Geology, Geophysics, and Geochemistry Science Center, Geology, Minerals, Energy, and Geophysics Science Center, Geosciences and Environmental Change Science Center, New Mexico Water Science Center, Southwest Biological Science Center, Denver Radiogenic Isotope Lab, National Water Quality Laboratory, New Mexico Water Science Center Sediment Laboratory, Organic Geochemistry Laboratory, Geological Materials Repository, Geology and Ecology of National Parks, Colorado River Basin: Actionable and Strategic Integrated Science and Technology

Medicine Bow LLFA Survey Map
A map of the airborne geophysical survey area in the Medicine Mountains region of Wyoming
A map of the airborne geophysical survey area in the Medicine Mountains region of Wyoming

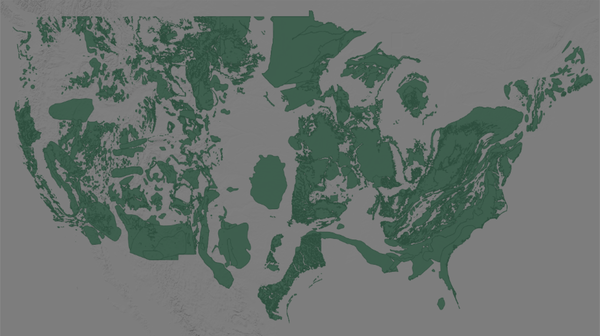
Mineral Systems Map of the United States
Maps showing parts of 23 mineral systems that could host critical mineral resources in the United States. These areas are used to prioritize data collection and analysis by Earth MRI.
Maps showing parts of 23 mineral systems that could host critical mineral resources in the United States. These areas are used to prioritize data collection and analysis by Earth MRI.

Montana
A view of the Boulder Mountains from US-12 west of Helena. These mountains lie at the north end of the Boulder Batholith.
A view of the Boulder Mountains from US-12 west of Helena. These mountains lie at the north end of the Boulder Batholith.

Space Economy Workshop Series
NASA and the United States Geological Survey (USGS) welcome the community to a series of Space Economy Workshops intended to coordinate the development of new technologies to detect and assess off-world mineral resources, as well as to discuss the challenges and opportunities for an off-world mineral resource economy.
NASA and the United States Geological Survey (USGS) welcome the community to a series of Space Economy Workshops intended to coordinate the development of new technologies to detect and assess off-world mineral resources, as well as to discuss the challenges and opportunities for an off-world mineral resource economy.

Aircraft with Geophysical Survey Equipment
A typical survey airplane. The magnetic sensor is placed in an extension on the back of the airplane to reduce the impact of the airplane’s own magnetic field.
A typical survey airplane. The magnetic sensor is placed in an extension on the back of the airplane to reduce the impact of the airplane’s own magnetic field.

Data Release Prospect- and Mine-Related Features from USGS Maps V9