
Example of elevation derived hydrogrpahy data
Images
Images intro.
Filter Total Items: 175

Elevation derived hydrography error example
Example of elevation derived hydrogrpahy data

Event Support Map
A satellite image of a hurricane centered over the Florida Keys, with a USGS logo displayed on the image.
A satellite image of a hurricane centered over the Florida Keys, with a USGS logo displayed on the image.

Graphic depiction of post-Harvey inundation map
Graphic copy of a USGS-generated Brazos River inundation map.
Graphic copy of a USGS-generated Brazos River inundation map.

Cook County, IL Lidar
This is a geiger mode lidar image colored by elevation over Cook County, Illinois
This is a geiger mode lidar image colored by elevation over Cook County, Illinois

Lidar Point Cloud USGS Headquarters Reston Image Symbology
Lidar point cloud image of USGS headquarters building in Reston, VA, shaded by RGB values from orthophotos
Lidar point cloud image of USGS headquarters building in Reston, VA, shaded by RGB values from orthophotos

Lidar Point Cloud USGS Headquarters Reston Elevation Symbology
Lidar point cloud image of USGS headquarters building in Reston, VA, shaded by elevation
Lidar point cloud image of USGS headquarters building in Reston, VA, shaded by elevation

Transportation layer from a 3/7/19 US Topo map
Selected area from a 3/7/19 US Topo map depicting the transportation features (roads, railroads) in the selection.
Selected area from a 3/7/19 US Topo map depicting the transportation features (roads, railroads) in the selection.

Image Depicting Transportation-Structures-Orthoimagery on 2019 US Topo
Image depicting transportation layer (left image) and structures / orthoimage layers (right image) from a selected area of a 2019 US Topo map of Dallas, TX.
Image depicting transportation layer (left image) and structures / orthoimage layers (right image) from a selected area of a 2019 US Topo map of Dallas, TX.

Dark Hollow Falls
Dark Hollow Falls - Shenandoah National Park, VA
Dark Hollow Falls - Shenandoah National Park, VA

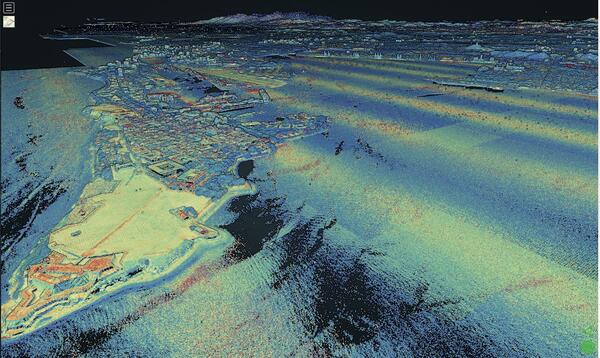
3DEP, Lidar point cloud, Pre-Hurricane Maria
Figure 2: Zooming in to red rectangle A from figure 1. Points colored by laser intensity (blue = low intensity, red = high intensity).
Figure 2: Zooming in to red rectangle A from figure 1. Points colored by laser intensity (blue = low intensity, red = high intensity).
Lidar point cloud, Pre-Hurricane PR, rotate and zoom
Figure 3: Zooming in and rotating scene in 3D from figure 2. Points coloer by laser intensity (blue = low intensity, red = high intensity).
Figure 3: Zooming in and rotating scene in 3D from figure 2. Points coloer by laser intensity (blue = low intensity, red = high intensity).

Rainbow over a canyon in the Grand Canyon, AZ
Rainbow over a canyon in the Grand Canyon, AZ
Rainbow over a canyon in the Grand Canyon, AZ

U.S. Federal Mapping Coordination (Seasketch) website
U.S. Federal Mapping Coordination site, managed by NOAA on the Seasketch platform. The site is used for federal agencies and their partners to collaborate on mapping data acquisition.
U.S. Federal Mapping Coordination site, managed by NOAA on the Seasketch platform. The site is used for federal agencies and their partners to collaborate on mapping data acquisition.

A 3DEP Image of Alaska's Denali Mountain
An oblique perspective of Alaska's Denali Mountain visualized by 3D Elevation Program lidar data.
An oblique perspective of Alaska's Denali Mountain visualized by 3D Elevation Program lidar data.

Mt. Kīlauea - July 2018
This image shows a lidar flight done in July 2018 of the Kīlauea volcano after the collapse of the caldera
This image shows a lidar flight done in July 2018 of the Kīlauea volcano after the collapse of the caldera

Group Photo of the Members of North American National Mapping meeting
This is a group shot of the North American National Mapping Meeting more information can be found at the website on the meeting
This is a group shot of the North American National Mapping Meeting more information can be found at the website on the meeting

Meeting collaboration going on in Reston VA
This is a wide panarama shot of the North American National Mapping Meeting more information can be found at the website on the meeting
This is a wide panarama shot of the North American National Mapping Meeting more information can be found at the website on the meeting

The NGP Director at North American National Mapping meeting
This is a group shot of the North American National Mapping Meeting more information can be found at the website on the meeting
This is a group shot of the North American National Mapping Meeting more information can be found at the website on the meeting

NGP Working Together
Two NGP staff members working together

Simulated flooding, Denver, CO
A 3D Elevation Program lidar point cloud colored by RGB color from imagery from the National Agriculture Imagery Program and showing simulated flooding (in blue) of an area in Denver, Colorado.
A 3D Elevation Program lidar point cloud colored by RGB color from imagery from the National Agriculture Imagery Program and showing simulated flooding (in blue) of an area in Denver, Colorado.

Lidar point cloud over Dulles Airport
Lidar point cloud over Dulles Airport
Lidar point cloud over Dulles Airport