
These “pom-pom” anemones (Liponema sp.) have attached to the rock in a place where there are probably very good currents, which bring small floating particles of food to them. Water depth is 1041 m (3415 ft).
Images
Images intro.
Filter Total Items: 87

Pom-pom anemone on the Pacific Ocean floor off California
These “pom-pom” anemones (Liponema sp.) have attached to the rock in a place where there are probably very good currents, which bring small floating particles of food to them. Water depth is 1041 m (3415 ft).

Sea life offshore of Morro Bay, California
A small juvenile skate (left) and a large rockfish (right) hang out on the murky, silty seafloor with sea stars. Water depth: 856 m (2808 ft).
A small juvenile skate (left) and a large rockfish (right) hang out on the murky, silty seafloor with sea stars. Water depth: 856 m (2808 ft).

Retrieving the MiniROV
Retrieving the MBARI (Monterey Bay Aquarium Research Institute) MiniROV from the Pacific Ocean offshore of California, on research vessel (R/V) Bold Horizon.
Retrieving the MBARI (Monterey Bay Aquarium Research Institute) MiniROV from the Pacific Ocean offshore of California, on research vessel (R/V) Bold Horizon.

Processing multi-channel seismic data
USGS scientist Pat Hart processing MCS data onboard the R/V Rachel Carson.
USGS scientist Pat Hart processing MCS data onboard the R/V Rachel Carson.

Topography and Bathymetry of Southern Cascadia
Topography and bathymetry of southern Cascadia, which includes southern Oregon and northern California (seafloor depths between 200 and 3000 m are shown in the spectrum color scale from red (shallower) to purple (deeper). The land and continental shelf are shown in grayscale slope shading where darker colors represent steeper slopes.
Topography and bathymetry of southern Cascadia, which includes southern Oregon and northern California (seafloor depths between 200 and 3000 m are shown in the spectrum color scale from red (shallower) to purple (deeper). The land and continental shelf are shown in grayscale slope shading where darker colors represent steeper slopes.

Mineral-laden water emerging from a hydrothermal vent
Mineral-laden water emerging from a hydrothermal vent on the Niua underwater volcano in the Lau Basin, southwest Pacific Ocean. As the water cools, minerals precipitate to form tower-like “chimneys.” Image taken during 2016 cruise “Virtual Vents.”
Mineral-laden water emerging from a hydrothermal vent on the Niua underwater volcano in the Lau Basin, southwest Pacific Ocean. As the water cools, minerals precipitate to form tower-like “chimneys.” Image taken during 2016 cruise “Virtual Vents.”

Perspective views of multibeam bathymetry data acquired by the USGS
Perspective views of multibeam bathymetry data acquired by the USGS aboard the R/V Medeia. Shallower depths in red. Arrows point to the distinct line in the seafloor associated with the Queen Charlotte-Fairweather fault.
Perspective views of multibeam bathymetry data acquired by the USGS aboard the R/V Medeia. Shallower depths in red. Arrows point to the distinct line in the seafloor associated with the Queen Charlotte-Fairweather fault.

Seafloor mapping systems
Graphic showing geophysical and sampling systems used to define the seafloor topography, surface sediments, and underlying geology.
Graphic showing geophysical and sampling systems used to define the seafloor topography, surface sediments, and underlying geology.

Multichannel seismic-reflection profile from Queen Charlotte-Fault
Multichannel seismic-reflection profile across the Queen Charlotte-Fairweather fault, acquired aboard the R/V Norseman in August 2016. Dashed red line in enlarged section at lower right is the Queen Charlotte-Fairweather fault. m, meter; km, kilometer; ms, millisecond.
Multichannel seismic-reflection profile across the Queen Charlotte-Fairweather fault, acquired aboard the R/V Norseman in August 2016. Dashed red line in enlarged section at lower right is the Queen Charlotte-Fairweather fault. m, meter; km, kilometer; ms, millisecond.
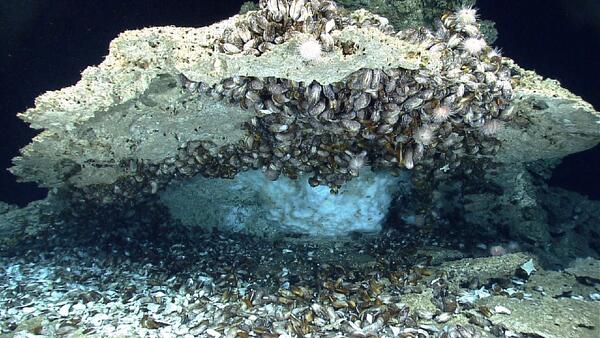
Ice-like gas hydrates under capping rock encrusted with mussels
Ice-like gas hydrates under capping rock encrusted with mussels on the sea floor of the northern Gulf of Mexico.
Ice-like gas hydrates under capping rock encrusted with mussels on the sea floor of the northern Gulf of Mexico.

Necker Ridge ferromanganese crust
Top of a ferromanganese crust sample collected from 1,896 meters water depth at Necker Ridge in the central north Pacific. The surface of this crust was in contact with ocean water and grew just 2 millimeters per million years.
Top of a ferromanganese crust sample collected from 1,896 meters water depth at Necker Ridge in the central north Pacific. The surface of this crust was in contact with ocean water and grew just 2 millimeters per million years.

Seafloor crust, Marshall Islands
Cross section of a seafloor crust (AKA, ferromanganese or cobalt-rich crusts) from the Marshall Islands collected at almost 2,000 meters depth.
Cross section of a seafloor crust (AKA, ferromanganese or cobalt-rich crusts) from the Marshall Islands collected at almost 2,000 meters depth.

Multichannel seismic-reflection profile, Sitka Sound
Multichannel seismic-reflection profile showing deformed and offset sediment layers below the outer continental shelf west of Sitka. The Sitka Sound fault is one of more than a dozen previously unmapped faults discovered in the July 2017 seismic-reflection data.
Multichannel seismic-reflection profile showing deformed and offset sediment layers below the outer continental shelf west of Sitka. The Sitka Sound fault is one of more than a dozen previously unmapped faults discovered in the July 2017 seismic-reflection data.

Multichannel seismic-reflection profile, QCF fault
Multichannel seismic-reflection profile showing deformed sediment layers on the Pacific plate, just seaward of the Queen Charlotte-Fairweather fault near the south end of the study area. Location of profile shown by southern-most yellow line on trackline map, near Noyes Cyn. (Canyon).
Multichannel seismic-reflection profile showing deformed sediment layers on the Pacific plate, just seaward of the Queen Charlotte-Fairweather fault near the south end of the study area. Location of profile shown by southern-most yellow line on trackline map, near Noyes Cyn. (Canyon).

Schematic showing how sediment on the seafloor moves
Schematic showing how sediment on the seafloor moves in response to a force created by the combined action of tides, ocean waves, and wind-driven currents.
Schematic showing how sediment on the seafloor moves in response to a force created by the combined action of tides, ocean waves, and wind-driven currents.

Phosphorite rock
Phosphorite rock formed on the seafloor in Southern California.
Phosphorite rock formed on the seafloor in Southern California.

Multichannel seismic streamer
A ship will tow this green cable, which contains underwater microphones that record sound reflected off layers beneath the seafloor. USGS scientists will use the data to pinpoint the location of faults.
A ship will tow this green cable, which contains underwater microphones that record sound reflected off layers beneath the seafloor. USGS scientists will use the data to pinpoint the location of faults.

Study region along the Queen Charlotte-Fairweather fault
Study region along the Queen Charlotte-Fairweather fault offshore southeastern Alaska. Rectangles show locations of the two USGS-led marine geophysical surveys in May and August 2015. The third cruise was offshore Haida Gwaii, British Columbia, and southern Alaska in September 2015.
Study region along the Queen Charlotte-Fairweather fault offshore southeastern Alaska. Rectangles show locations of the two USGS-led marine geophysical surveys in May and August 2015. The third cruise was offshore Haida Gwaii, British Columbia, and southern Alaska in September 2015.

Sampling gas released by gas hydrate breakdown
Pamela Swarzenski from the USGS Pacific Coastal and Marine Science Center sampling gas released by gas hydrate breakdown during a quantitative degassing aboard the drilling vessel Chikyu during the Indian Government’s National Gas Hydrates Program (NGHP-02) drilling expedition offshore from eastern India.
Pamela Swarzenski from the USGS Pacific Coastal and Marine Science Center sampling gas released by gas hydrate breakdown during a quantitative degassing aboard the drilling vessel Chikyu during the Indian Government’s National Gas Hydrates Program (NGHP-02) drilling expedition offshore from eastern India.

Queen Charlotte-Fairweather fault
Enlarged details of Survey Area 1 showing new multibeam bathymetry data (rainbow colors) acquired on R/V Solstice near Cross Sound and Glacier Bay National Park, southeastern Alaska. Arrows highlight the surface expression, or trace, of the Queen Charlotte-Fairweather fault.
Enlarged details of Survey Area 1 showing new multibeam bathymetry data (rainbow colors) acquired on R/V Solstice near Cross Sound and Glacier Bay National Park, southeastern Alaska. Arrows highlight the surface expression, or trace, of the Queen Charlotte-Fairweather fault.

Multichannel seismic-reflection profile
Multichannel seismic-reflection profile showing sediment layers beneath the seafloor disrupted by the Queen Charlotte-Fairweather fault near Cross Sound. The profile is approximately 16 kilometers across, and it extends approximately 370 meters beneath the seafloor. See related multimedia below, for the location of this profile.
Multichannel seismic-reflection profile showing sediment layers beneath the seafloor disrupted by the Queen Charlotte-Fairweather fault near Cross Sound. The profile is approximately 16 kilometers across, and it extends approximately 370 meters beneath the seafloor. See related multimedia below, for the location of this profile.