
Graphs showing trends in atmospheric precipitation and air temperature in the Lower Colorado River Basin, 1896-2019
Images
Below are images associated with the Arizona Water Science Center.
Filter Total Items: 26

Lower Colorado Basin Precipitation Temperature 1896-2019_graph.jpg
Graphs showing trends in atmospheric precipitation and air temperature in the Lower Colorado River Basin, 1896-2019

Graph showing trends in annual total precipitation and annual average air temperature in the Lower Colorado River Basin
linkGraphs showing trends in the sum of annual atmospheric precipitation and annual average air temperature in the Lower Colorado River Basin, 1896-2019
Graph showing trends in annual total precipitation and annual average air temperature in the Lower Colorado River Basin
linkGraphs showing trends in the sum of annual atmospheric precipitation and annual average air temperature in the Lower Colorado River Basin, 1896-2019

Graph showing 1951-2020 and 2020-2099 precipitation and temperatures.jpg
Boxplots showing precipitation and temperature ranges from 1951-2019 and 2020-2099 in the Colorado River Basin, by Tillman and others (2020), USGS SIR 2020-5107
Boxplots showing precipitation and temperature ranges from 1951-2019 and 2020-2099 in the Colorado River Basin, by Tillman and others (2020), USGS SIR 2020-5107

Graph showing 1896-2019 precipitation and temperatures in the CRB.jpg
Graphs showing trends in precipitation and temperature in the Colorado River Basin, 1896-2019, published in Tillman and others (2020), USGS SIR 2020-5107
Graphs showing trends in precipitation and temperature in the Colorado River Basin, 1896-2019, published in Tillman and others (2020), USGS SIR 2020-5107

Map showing current and past projects of the USGS Southwest Gravity Program
The USGS Southwest Gravity Program carries out gravity projects for aquifer-storage monitoring and geologic modeling in California, Arizona, and New Mexico. This map shows the location of 24 projects carried out since 2010.
The USGS Southwest Gravity Program carries out gravity projects for aquifer-storage monitoring and geologic modeling in California, Arizona, and New Mexico. This map shows the location of 24 projects carried out since 2010.

Gravity meter sensitivity to mass change in the subsurface
As generalized in this image, a gravity measurement is sensitive to a cone-shaped region of the subsurface—as depth increases, the sensitivity to individual water molecules decreases, but the region of sensitivity expands.
As generalized in this image, a gravity measurement is sensitive to a cone-shaped region of the subsurface—as depth increases, the sensitivity to individual water molecules decreases, but the region of sensitivity expands.

Location map of salinity monitoring locations in the Yuma area.
Map of study area and location of data collection sites in the Yuma, Arizona, area between Imperial Dam and the southerly international boundary between the United States and Mexico,
Map of study area and location of data collection sites in the Yuma, Arizona, area between Imperial Dam and the southerly international boundary between the United States and Mexico,

Plot of dissolved solids at Colorado River below Cooper Wasteway
Line graph showing modeled continuous dissolved-solids concentration and sampled dissolved-solids concentration at station 09522005 (Colorado River below Cooper wasteway near Yuma, Arizona) and streamflow at station 09522000 (Colorado River at NIB, above Morelos Dam, Arizona) from January 2017 to March 2019.
Line graph showing modeled continuous dissolved-solids concentration and sampled dissolved-solids concentration at station 09522005 (Colorado River below Cooper wasteway near Yuma, Arizona) and streamflow at station 09522000 (Colorado River at NIB, above Morelos Dam, Arizona) from January 2017 to March 2019.
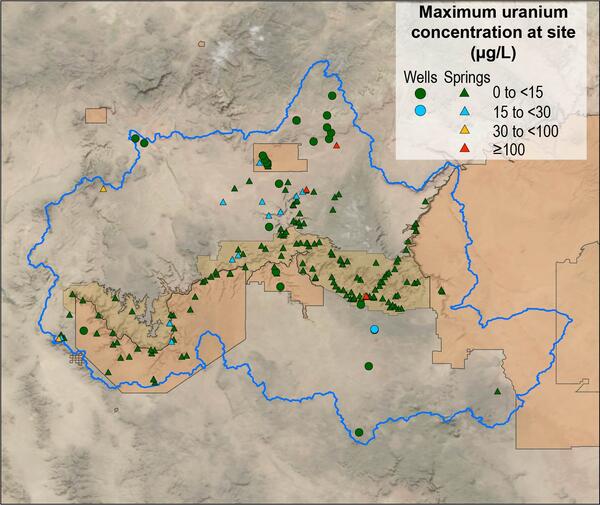
Map of Grand Canyon uranium concentrations as spring and well sites
Map of maximum uranium concentration at 206 spring and well sites in the Grand Canyon region.
Map of maximum uranium concentration at 206 spring and well sites in the Grand Canyon region.

Extensometer Well in Avra Valey, Arizona
This is an image of an extensometer well part of the Tucson Extensometer Well Network. This well is located in Avra Valley, AZ.
This is an image of an extensometer well part of the Tucson Extensometer Well Network. This well is located in Avra Valley, AZ.

Flooding at Vekol Wash, Arizona
Flooding at Vekol Wash today, south of Phoenix, following remnant rains from Hurricane Rosa.
Flooding at Vekol Wash today, south of Phoenix, following remnant rains from Hurricane Rosa.

Unmanned Aerial System in Flight
Small Unmanned Aerial System (UAS) collecting digital photos to create digital elevation models. UAS are an increasingly important tool for monitoring, assessing, and conducting targeted scientific research for the nation.
Small Unmanned Aerial System (UAS) collecting digital photos to create digital elevation models. UAS are an increasingly important tool for monitoring, assessing, and conducting targeted scientific research for the nation.

Changing vegetation in the Delta 2016-2017
Chart showing changes in vegetation density in the Mississippi River delta in Louisiana, May 2015-May 2016. From a USGS Open File Report published in July 2017 by co-authors Elijah Ramsey III and Amina Rangoonwala,
Chart showing changes in vegetation density in the Mississippi River delta in Louisiana, May 2015-May 2016. From a USGS Open File Report published in July 2017 by co-authors Elijah Ramsey III and Amina Rangoonwala,

Havasu Falls
Havasu Creek spilling over Havasu Falls, downstream from Supai Village on the Havasupai Nation.
Havasu Creek spilling over Havasu Falls, downstream from Supai Village on the Havasupai Nation.

Colorado River at Imperial Dam
Colorado River at Imperial Dam northeast of Yuma, Arizona. Gates in the foreground supply Colorado River water to desilting ponds before being diverted to the All American Canal.
Colorado River at Imperial Dam northeast of Yuma, Arizona. Gates in the foreground supply Colorado River water to desilting ponds before being diverted to the All American Canal.

Trail head to Lower Jumpup Spring, north of Grand Canyon.
Trail head sign to Lower Jumpup Spring, north of Grand Canyon.
Trail head sign to Lower Jumpup Spring, north of Grand Canyon.

San Pedro Riparian National Conservation Area
Photograph showing San Pedro Riparian National Conservation Area, residential development southeast of Sierra Vista, Arizona, and the Huachuca Mountains from Hereford Road, Cochise County, Arizona.
Photograph showing San Pedro Riparian National Conservation Area, residential development southeast of Sierra Vista, Arizona, and the Huachuca Mountains from Hereford Road, Cochise County, Arizona.

Kanab_North_Mine.JPG
Former Kanab North uranium mine on the edge of Kanab Creek, north of Grand Canyon.
Former Kanab North uranium mine on the edge of Kanab Creek, north of Grand Canyon.

Turbid Coastal Plume of the Elwha River, Washington
The turbid waters of the Elwha River and the coastal waters of the Strait of Juan de Fuca mix directly offshore of the river mouth, forming a large coastal plume. This plume is easily identified by the cloudiness of the water (or "turbidity") resulting from sediment discharged by the river. Two large dams on the Elwha River were incrementally r
The turbid waters of the Elwha River and the coastal waters of the Strait of Juan de Fuca mix directly offshore of the river mouth, forming a large coastal plume. This plume is easily identified by the cloudiness of the water (or "turbidity") resulting from sediment discharged by the river. Two large dams on the Elwha River were incrementally r

Turbid Coastal Plume of the Elwha River, Washington
The turbid waters of the Elwha River and the coastal waters of the Strait of Juan de Fuca mix directly offshore of the river mouth, forming a large coastal plume. This plume is easily identified by the cloudiness of the water (or "turbidity") resulting from sediment discharged by the river. Two large dams on the Elwha River are being incrementally r
The turbid waters of the Elwha River and the coastal waters of the Strait of Juan de Fuca mix directly offshore of the river mouth, forming a large coastal plume. This plume is easily identified by the cloudiness of the water (or "turbidity") resulting from sediment discharged by the river. Two large dams on the Elwha River are being incrementally r

Rain Gage, Montezuma Pass, AZ
Remote rain gage affixed to the roof line of a building at the top of Montezuma Pass, Arizona.
Remote rain gage affixed to the roof line of a building at the top of Montezuma Pass, Arizona.