
Pyramid Lake is one of the largest natural lakes in the state of Nevada, covering an area of about 188 square miles (487 square kilometers). Located entirely within the Pyramid Lake Paiute Tribe Reservation on the western margin of the Great Basin Desert, this deep terminal lake is widely regarded as a world class fishery.
Images
Peruse our selection of remote sensing and Earth science imagery below.
Filter Total Items: 790
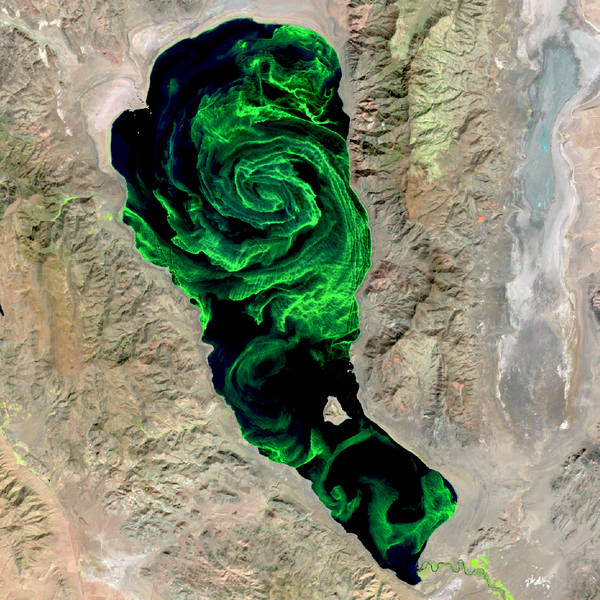
Pyramid Lake in Nevada with Algal Bloom
Pyramid Lake is one of the largest natural lakes in the state of Nevada, covering an area of about 188 square miles (487 square kilometers). Located entirely within the Pyramid Lake Paiute Tribe Reservation on the western margin of the Great Basin Desert, this deep terminal lake is widely regarded as a world class fishery.

Landsat 7 Images of Las Vegas, 1999-2024
Las Vegas, Nevada and the area surrounding has been and remains a popular region of interest when showcasing urban growth and land change using Landsat sensors.
Las Vegas, Nevada and the area surrounding has been and remains a popular region of interest when showcasing urban growth and land change using Landsat sensors.

Landsat 9 image of eutrophication in Lake Thompson, South Dakota
A September 20, 2024, Landsat 9 satellite image of eutrophication in Lake Thompson, South Dakota. Eutrophication because of phosphate fertilizer use is probably one of the most notable impacts on the environment, society and the economy.
A September 20, 2024, Landsat 9 satellite image of eutrophication in Lake Thompson, South Dakota. Eutrophication because of phosphate fertilizer use is probably one of the most notable impacts on the environment, society and the economy.

Annual NLCD ScienceBase
Annual NLCD science products are available for download on the U.S Geological Survey (USGS repository. All six science products from 1985-2023 for the conterminous United States).
Annual NLCD science products are available for download on the U.S Geological Survey (USGS repository. All six science products from 1985-2023 for the conterminous United States).

Annual NLCD Land Cover 1985
Zoomed in image of Annual NLCD Land Cover in 1985. Annual NLCD Land Cover science product represents the most likely thematic land cover type of the Anderson Level II classes.
Zoomed in image of Annual NLCD Land Cover in 1985. Annual NLCD Land Cover science product represents the most likely thematic land cover type of the Anderson Level II classes.

Annual NLCD Land Cover 2023
A zoomed in image of Annual NLCD Land Cover in 2023 for Silverdale, Washington. Annual NLCD Land Cover science product represents the most likely thematic land cover type of the Anderson Level II classes. Learn more about Annual NLCD.
A zoomed in image of Annual NLCD Land Cover in 2023 for Silverdale, Washington. Annual NLCD Land Cover science product represents the most likely thematic land cover type of the Anderson Level II classes. Learn more about Annual NLCD.

MRLC Viewer
The Multi-Resolution Land Characteristics (MRLC) Consortium has several different ways to access data, including a web-visualization tool. Users have the ability of several different download methods on the viewer: drawing a rectangle, drawing a polygon, entering GeoJSON information, and uploading a shapefile.
The Multi-Resolution Land Characteristics (MRLC) Consortium has several different ways to access data, including a web-visualization tool. Users have the ability of several different download methods on the viewer: drawing a rectangle, drawing a polygon, entering GeoJSON information, and uploading a shapefile.

MRLC Data Download site
The Multi-Resolution Land Characteristics (MRLC) consortium hosts land cover and land condition data from various sources, including Annual NLCD. Annual NLCD science products are found under the projects tab, and user have the ability to download Annual NLCD CONUS mosaics from 1985-2023.
The Multi-Resolution Land Characteristics (MRLC) consortium hosts land cover and land condition data from various sources, including Annual NLCD. Annual NLCD science products are found under the projects tab, and user have the ability to download Annual NLCD CONUS mosaics from 1985-2023.

Annual NLCD EVA Tool
The Multi-Resolution Land Characteristics (MRLC) Consortium provides users with the Enhanced Visualization and Analysis (EVA) tool, which allows users to interact with Annual NLCD science products at the county level between two different dates. The EVA tool creates landcover analysis and the user has the ability to generate a more detailed report.
The Multi-Resolution Land Characteristics (MRLC) Consortium provides users with the Enhanced Visualization and Analysis (EVA) tool, which allows users to interact with Annual NLCD science products at the county level between two different dates. The EVA tool creates landcover analysis and the user has the ability to generate a more detailed report.

TimeSync Viewer
Annual NLCD Reference and Validation (R&V) program is in the process of collecting an independent reference dataset of 10,000 plots at the Anderson Level II level. The TimeSync tool is used to record attribute information for each plot. On the interface, the drop in NDVI values is noticeable.
Annual NLCD Reference and Validation (R&V) program is in the process of collecting an independent reference dataset of 10,000 plots at the Anderson Level II level. The TimeSync tool is used to record attribute information for each plot. On the interface, the drop in NDVI values is noticeable.

Annual NLCD Spectral Change Day of Year cropped
Depicts the day-of-year (DOY) on which a significant deviation in Landsat surface reflectance was detected within the calendar year. Area around Marysville, WA is depicted in the image.
Depicts the day-of-year (DOY) on which a significant deviation in Landsat surface reflectance was detected within the calendar year. Area around Marysville, WA is depicted in the image.

Annual NLCD Land Cover Confidence Index Cropped
Annual NLCD land cover confidence product provides the level of confidence that Annual NLCD land cover class per pixel values that matches the training data. The image shows an area around Marysville, WA.
Annual NLCD land cover confidence product provides the level of confidence that Annual NLCD land cover class per pixel values that matches the training data. The image shows an area around Marysville, WA.

Annual NLCD Spectral Change Day of Year
Depicts the day-of-year (DOY) on which a significant deviation in Landsat surface reflectance was detected within the calendar year of an area around Marysville, WA
Depicts the day-of-year (DOY) on which a significant deviation in Landsat surface reflectance was detected within the calendar year of an area around Marysville, WA
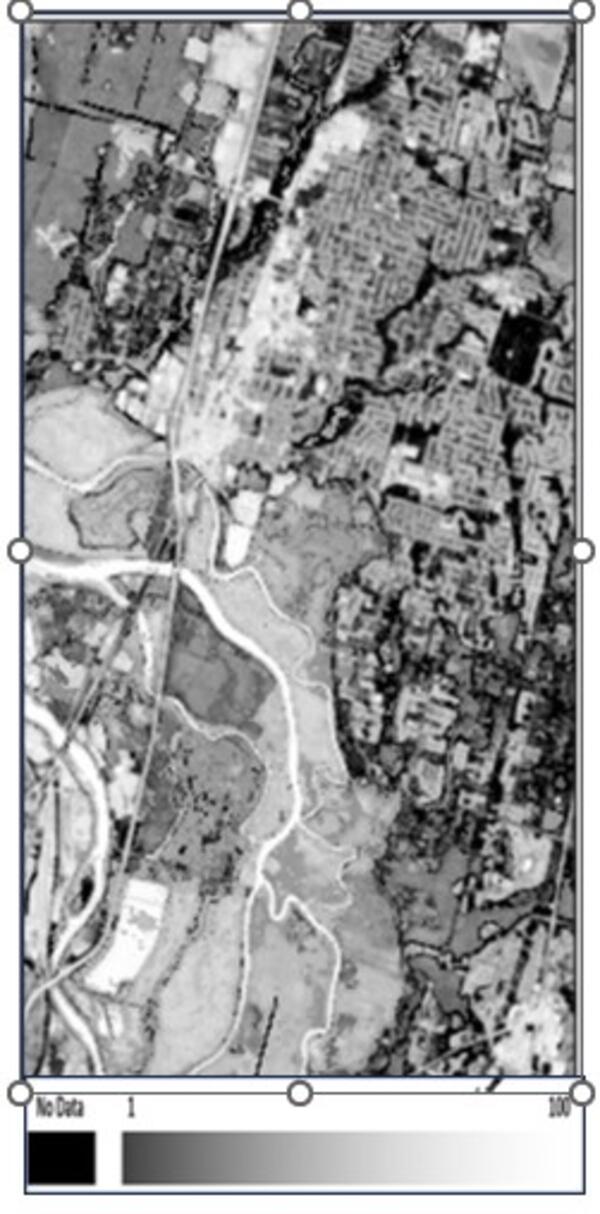
Annual NLCD Land Cover Confidence Index
Annual NLCD land cover confidence product provides the level of confidence that Annual NLCD land cover class per pixel values that matches the training data. The image shown is around Marysville, WA.
Annual NLCD land cover confidence product provides the level of confidence that Annual NLCD land cover class per pixel values that matches the training data. The image shown is around Marysville, WA.

Annual NLCD Land Cover cropped
Annual NLCD generates a product suite of six land use and land cover themes from 1985-2023. The Annual NLCD Land Cover product Depicts the predominant thematic land cover class within the mapping year with respect to broad categories of artificial or natural surface cover. The image shows an area around Marysville, WA.
Annual NLCD generates a product suite of six land use and land cover themes from 1985-2023. The Annual NLCD Land Cover product Depicts the predominant thematic land cover class within the mapping year with respect to broad categories of artificial or natural surface cover. The image shows an area around Marysville, WA.

Annual NLCD Land Cover
Annual NLCD generates a product suite of six land use and land cover themes from 1985-2023. The Annual NLCD Land Cover product Depicts the predominant thematic land cover class within the mapping year with respect to broad categories of artificial or natural surface cover. The image shows an area around Marysville, WA.
Annual NLCD generates a product suite of six land use and land cover themes from 1985-2023. The Annual NLCD Land Cover product Depicts the predominant thematic land cover class within the mapping year with respect to broad categories of artificial or natural surface cover. The image shows an area around Marysville, WA.

Annual NLCD Impervious Descriptor cropped
The Annual National Land Cover Database (NLCD) impervious descriptor product generates a raster layer that differentiates between urban and road surfaces. The image shows an area around Marysville, WA.
The Annual National Land Cover Database (NLCD) impervious descriptor product generates a raster layer that differentiates between urban and road surfaces. The image shows an area around Marysville, WA.

Annual NLCD Fractional Impervious Surface Cropped
Depicts the fractional surface area of the map unit (pixel) that is covered with artificial substrate or structures. The image shows an area around Marysville, WA.
Depicts the fractional surface area of the map unit (pixel) that is covered with artificial substrate or structures. The image shows an area around Marysville, WA.

Annual NLCD Land Cover Change cropped
Annual NLCD land cover change product shows the change between the current year’s primary land cover and the prior year’s land cover when there is a change in primary class. The image shows an area around Marysville, WA.
Annual NLCD land cover change product shows the change between the current year’s primary land cover and the prior year’s land cover when there is a change in primary class. The image shows an area around Marysville, WA.

Annual NLCD Land Cover Change Legend
The Annual National Land Cover Database (NLCD) land cover change legend contains all of the annual NLCD land cover classes plus the land cover classification change classes. Annual NLCD Land Cover Change land cover change product contains a total of 241 land cover classes.
The Annual National Land Cover Database (NLCD) land cover change legend contains all of the annual NLCD land cover classes plus the land cover classification change classes. Annual NLCD Land Cover Change land cover change product contains a total of 241 land cover classes.

Annual NLCD Land Cover Change Legend
Annual National Land Cover Database (Annual NLCD) land cover legend contains 16 land cover classes based on the Anderson Level II classification system.
Annual National Land Cover Database (Annual NLCD) land cover legend contains 16 land cover classes based on the Anderson Level II classification system.