
On Tuesday, January 21, 2025, Winter Storm Enzo brought an exceptionally rare snowfall to the Greater Houston metro area of Texas. The National Weather Service reported 5.5 inches (14 cm) in Baytown, a city located east of Houston on the northern shore of Galveston Bay. Other cities and locales received upwards of 3 to 4 inches (7.6 to 10.2 cm).
Images
Peruse our selection of remote sensing and Earth science imagery below.
Filter Total Items: 790

Landsat 8 Image of Snowfall in Houston, Texas
On Tuesday, January 21, 2025, Winter Storm Enzo brought an exceptionally rare snowfall to the Greater Houston metro area of Texas. The National Weather Service reported 5.5 inches (14 cm) in Baytown, a city located east of Houston on the northern shore of Galveston Bay. Other cities and locales received upwards of 3 to 4 inches (7.6 to 10.2 cm).

LCMAP 1985 Land Cover for California
This map of California displays the LCMAP (Land Change Monitoring, Assessment and Projection) Primary Land Cover for California in 1985. The green represents forests (tree cover). Learn more in a study. USGS EROS map
This map of California displays the LCMAP (Land Change Monitoring, Assessment and Projection) Primary Land Cover for California in 1985. The green represents forests (tree cover). Learn more in a study. USGS EROS map

LCMAP 2021 Land Cover for California
This map of California displays the LCMAP (Land Change Monitoring, Assessment and Projection) Primary Land Cover for California in 2021. The green represents forests (tree cover). Learn more in the study. USGS EROS map
This map of California displays the LCMAP (Land Change Monitoring, Assessment and Projection) Primary Land Cover for California in 2021. The green represents forests (tree cover). Learn more in the study. USGS EROS map

Landsat Collection 2 Level-2 Science Products
The USGS provides research-quality, applications-ready Landsat Level-2 and Level-3 science products to support an array of land surface change studies. Collection 2 Level-2 scene-based science products include Surface Reflectance, Surface Temperature, Surface Reflectance-Derived Spectral Indices, and Provisional Aquatic Reflectance.
The USGS provides research-quality, applications-ready Landsat Level-2 and Level-3 science products to support an array of land surface change studies. Collection 2 Level-2 scene-based science products include Surface Reflectance, Surface Temperature, Surface Reflectance-Derived Spectral Indices, and Provisional Aquatic Reflectance.

LCMAP land cover and Landsat imagery from 1985 to 2021 in California's Butte and Plumas counties
linkThese animations are from Butte and Plumas counties in northeastern California from 1985 to 2021. On the left is Land Change Monitoring, Assessment and Projection, or LCMAP (v1.3), land cover, with green representing forests (tree cover). On the right is true-color Landsat satellite imagery.

LCMAP land cover and Landsat imagery from 1985 to 2021 of the Wragg Fire area in California
These animations are from the Wragg Fire that occurred north of San Francisco, California, in 2015. On the left is Land Change Monitoring, Assessment and Projection, or LCMAP (v1.3), land cover, with green representing forests (tree cover). On the right is false-color Landsat satellite imagery.
These animations are from the Wragg Fire that occurred north of San Francisco, California, in 2015. On the left is Land Change Monitoring, Assessment and Projection, or LCMAP (v1.3), land cover, with green representing forests (tree cover). On the right is false-color Landsat satellite imagery.

Landsat 8 Image of the Salt Dome Islands of Louisiana
Louisiana is home to numerous salt domes, including the five distinct coastal salt dome islands that can be found in the southern part of the state near the Gulf of America. Formed by the upward pressure of ancient salt deposits, these hills rise above the surrounding marshes and coastal plains of Louisiana.
Louisiana is home to numerous salt domes, including the five distinct coastal salt dome islands that can be found in the southern part of the state near the Gulf of America. Formed by the upward pressure of ancient salt deposits, these hills rise above the surrounding marshes and coastal plains of Louisiana.

Debut of the Annual National Land Cover Database (NLCD)
Poster introducing the 2023 Annual National Land Cover Database (NLCD). "Development and Cloud Implementation of the New Annual NLCD for the United States." Created by USGS Earth Resources Observation and Science (EROS) Center. Find full PDF here.
Poster introducing the 2023 Annual National Land Cover Database (NLCD). "Development and Cloud Implementation of the New Annual NLCD for the United States." Created by USGS Earth Resources Observation and Science (EROS) Center. Find full PDF here.

Landsat 9 Image of the Greater Los Angeles Fires - January 14, 2025 (During)
The tragic fires sweeping across the Greater Los Angeles area in January 2025 have burned more than 40,000 acres, destroyed more than 12,300 structures, and prompted evacuation orders and warnings for as many as 200,000 residents. Exceptionally dry conditions, coupled with strong Santa Ana winds, have fueled the fires.
The tragic fires sweeping across the Greater Los Angeles area in January 2025 have burned more than 40,000 acres, destroyed more than 12,300 structures, and prompted evacuation orders and warnings for as many as 200,000 residents. Exceptionally dry conditions, coupled with strong Santa Ana winds, have fueled the fires.

Landsat 9 Sees Diverse Landscapes of the Desert Southwest
The USGS EROS Landsat archive recently reached a milestone of 12 million Landsat Collection 2 Level-1 products. These are available for download at no charge. The image representing this milestone displays a sprawling desert landscape and contains a multitude of agricultural, geological, and urban features.
The USGS EROS Landsat archive recently reached a milestone of 12 million Landsat Collection 2 Level-1 products. These are available for download at no charge. The image representing this milestone displays a sprawling desert landscape and contains a multitude of agricultural, geological, and urban features.

Landsat 8 Image of the Greater Los Angeles Fires - January 6, 2025 (Before)
The tragic fires sweeping across the Greater Los Angeles area have burned more than 40,000 acres, destroyed more than 12,300 structures, and prompted evacuation orders and warnings for as many as 200,000 residents. Exceptionally dry conditions, coupled with strong Santa Ana winds, have fueled the fires.
The tragic fires sweeping across the Greater Los Angeles area have burned more than 40,000 acres, destroyed more than 12,300 structures, and prompted evacuation orders and warnings for as many as 200,000 residents. Exceptionally dry conditions, coupled with strong Santa Ana winds, have fueled the fires.

Landsat 9 Image of Emi Koussi in Chad
Landsat 8 and Landsat 9 kicked off 2025 by acquiring over 1,400 scenes on the first of January. This Landsat 9 image of Emi Koussi in the Tibesti Range of Chad is a mosaic of two of the many scenes collected. Emi Koussi is an extinct shield volcano that rises to 11,204 feet (3,415 meters) above sea level, making it the highest summit in Chad and the Sahara Desert.
Landsat 8 and Landsat 9 kicked off 2025 by acquiring over 1,400 scenes on the first of January. This Landsat 9 image of Emi Koussi in the Tibesti Range of Chad is a mosaic of two of the many scenes collected. Emi Koussi is an extinct shield volcano that rises to 11,204 feet (3,415 meters) above sea level, making it the highest summit in Chad and the Sahara Desert.

Cumulative Number of Landsat Scenes
The USGS Landsat archive holds over fifty years of Earth-Observing satellite data. This animation displays the cumulative number of Landsat scenes since 1972. The colors on the maps show the density of the number of Landsat Level-1 products.
The USGS Landsat archive holds over fifty years of Earth-Observing satellite data. This animation displays the cumulative number of Landsat scenes since 1972. The colors on the maps show the density of the number of Landsat Level-1 products.

Burn Severity Map of the August Complex Wildfire
Burn Severity Map of the August Complex wildfire, created by the USGS Burned Area Emergency Response (BAER) program. The August Complex, which burned over 1 million acres in California in 2020, is the largest wildfire in state history.
Burn Severity Map of the August Complex wildfire, created by the USGS Burned Area Emergency Response (BAER) program. The August Complex, which burned over 1 million acres in California in 2020, is the largest wildfire in state history.

Landsat Mosaic of the Wind River Range in Wyoming
The Wind River Range, located in west-central Wyoming, is a unique wilderness area that rises from the high plains of the South Pass of the Continental Divide and runs northwest to the Yellowstone Plateau. The Winds, as they are affectionately known, are exceptionally long, wide, high, rugged, and remote.
The Wind River Range, located in west-central Wyoming, is a unique wilderness area that rises from the high plains of the South Pass of the Continental Divide and runs northwest to the Yellowstone Plateau. The Winds, as they are affectionately known, are exceptionally long, wide, high, rugged, and remote.

1m DEM for the Lower Androscoggin watershed
A seamless 1-meter Digital Elevation Model (DEM) for the Lower Androscoggin watershed in Maine, produced by scientists at the USGS National Geospatial Technical Operations Center (NGTOC) and USGS Earth Resources Observation and Science (EROS) Center. Elevations run from low elevation in light blue on up to tan, green, yellow, red and finally gray/white.
A seamless 1-meter Digital Elevation Model (DEM) for the Lower Androscoggin watershed in Maine, produced by scientists at the USGS National Geospatial Technical Operations Center (NGTOC) and USGS Earth Resources Observation and Science (EROS) Center. Elevations run from low elevation in light blue on up to tan, green, yellow, red and finally gray/white.

Landsat 8 Image of Lake Thompson in South Dakota
Landsat 8 image of Lake Thompson in South Dakota, showing a November algal bloom.
Image date: November 22, 2024
Path 30, Row 29
Band combinations: 654 (false color) to show the algal bloom, and then blended with 432 (natural color) to show the snow.
Landsat 8 image of Lake Thompson in South Dakota, showing a November algal bloom.
Image date: November 22, 2024
Path 30, Row 29
Band combinations: 654 (false color) to show the algal bloom, and then blended with 432 (natural color) to show the snow.

Thumbnail Image for 1 Hour of Earth From Above
Thumbnail image for video: 1 Hour of Earth From Above: Relaxing Landsat Satellite Imagery
Watch here: https://eros.usgs.gov/media-gallery/video-landsat/landsat-1-hour-of-ima…
Thumbnail image for video: 1 Hour of Earth From Above: Relaxing Landsat Satellite Imagery
Watch here: https://eros.usgs.gov/media-gallery/video-landsat/landsat-1-hour-of-ima…
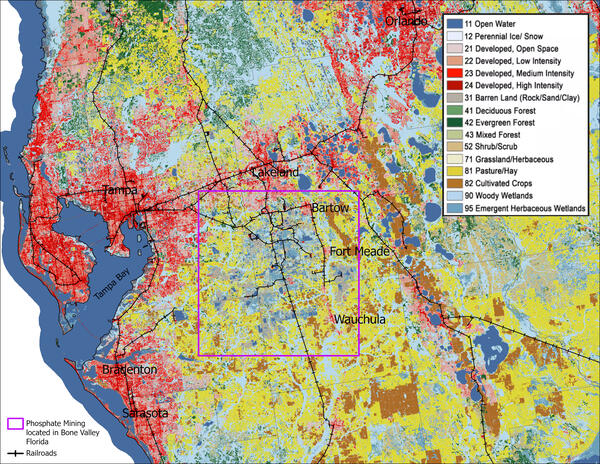
Annual NLCD Land Cover and railroads in central Florida
Annual National Land Cover Database (NLCD) 2023 Land Cover in central Florida, with black lines representing railroads that crisscross the region. Railroads are integral in the phosphate mining process.
Annual National Land Cover Database (NLCD) 2023 Land Cover in central Florida, with black lines representing railroads that crisscross the region. Railroads are integral in the phosphate mining process.

Annual NLCD Land Cover image of Bone Valley, Florida, in 1985
Annual National Land Cover Database image of Land Cover for Bone Valley, Florida, in 1985. Barren land cover (gray) and ponded water (dark blue) are typical of an active mine. Natural vegetation includes grassland (light tan), pasture/hay (yellow), wetland (light blue colors) and shrubland (dark tan). Urban areas are shown in shades of red.
Annual National Land Cover Database image of Land Cover for Bone Valley, Florida, in 1985. Barren land cover (gray) and ponded water (dark blue) are typical of an active mine. Natural vegetation includes grassland (light tan), pasture/hay (yellow), wetland (light blue colors) and shrubland (dark tan). Urban areas are shown in shades of red.

Annual NLCD Land Cover image of Bone Valley, Florida, in 2023
Annual National Land Cover Database image of Land Cover for Bone Valley, Florida, in 2023. Barren land cover (gray) and ponded water (dark blue) are typical of an active mine. Natural vegetation includes grassland (light tan), pasture/hay (yellow), wetland (light blue colors) and shrubland (dark tan). Urban areas are shown in shades of red.
Annual National Land Cover Database image of Land Cover for Bone Valley, Florida, in 2023. Barren land cover (gray) and ponded water (dark blue) are typical of an active mine. Natural vegetation includes grassland (light tan), pasture/hay (yellow), wetland (light blue colors) and shrubland (dark tan). Urban areas are shown in shades of red.