
Relative landslide hazard from Hurricane Helene. Dark purple shows locations expected to have experienced the highest landslide occurrence. Map based on cumulative precipitation estimate (NWS Greenville-Spartanburg from 9/24-9/28) and the USGS Landslide Susceptibility Map.
Images
Geologic Hazards Science Center images.
Filter Total Items: 238

Hurricane Helene Landslide Hazard Estimate Map
Relative landslide hazard from Hurricane Helene. Dark purple shows locations expected to have experienced the highest landslide occurrence. Map based on cumulative precipitation estimate (NWS Greenville-Spartanburg from 9/24-9/28) and the USGS Landslide Susceptibility Map.

¿Dónde Ocurren los Deslizamientos de Tierra?
¿Dónde Ocurren los Deslizamientos de Tierra?
(Mapa Nacional de Susceptibilidad a Deslizamientos de Tierra, 2024)
¿Dónde Ocurren los Deslizamientos de Tierra?
(Mapa Nacional de Susceptibilidad a Deslizamientos de Tierra, 2024)

Where Do Landslides Occur?
A map of the United States including Hawaii, Alaska, and Puerto Rico shows landslide susceptibility from yellow (low) to red (high), where the areas without shading represent negligible potential for landslides.
A map of the United States including Hawaii, Alaska, and Puerto Rico shows landslide susceptibility from yellow (low) to red (high), where the areas without shading represent negligible potential for landslides.

2024 Pedersen Lagoon Landslide Runout
Lower portion of the landslide runout along the Pedersen Glacier from the 2024 Pedersen Lagoon landslide in Alaska.
Lower portion of the landslide runout along the Pedersen Glacier from the 2024 Pedersen Lagoon landslide in Alaska.

2024 Pedersen Lagoon Landslide Source Area and Runout
Landslide source area and upper portion of the landslide runout. The upper reaches of the landslide source material of the 2024 Pedersen Lagoon landslide in Alaska.
Landslide source area and upper portion of the landslide runout. The upper reaches of the landslide source material of the 2024 Pedersen Lagoon landslide in Alaska.

2024 Pedersen Lagoon Landslide Tsunami Damage
Tsunami damage between the upper and lower portions of the lagoon from the landslide-generated tsunami from the 2024 Pedersen Lagoon landslide in Alaska. It moved toward the east at the western shore and uplands of the landform between the lagoons.
Tsunami damage between the upper and lower portions of the lagoon from the landslide-generated tsunami from the 2024 Pedersen Lagoon landslide in Alaska. It moved toward the east at the western shore and uplands of the landform between the lagoons.

Intern giving poster presentation at 2024 GHSC Intern Research Symposium
Intern giving poster presentation with equipment on display at 2024 GHSC Intern Research Symposium
Intern giving poster presentation with equipment on display at 2024 GHSC Intern Research Symposium
Intern giving oral presentation at 2024 GHSC Intern Research Symposium
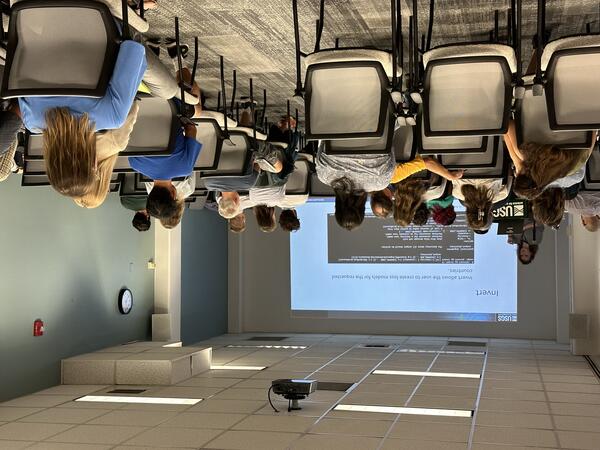
Intern giving oral presentation with slides at 2024 GHSC Intern Research Symposium
Intern giving oral presentation with slides at 2024 GHSC Intern Research Symposium

"Meet the USGS Interns - Earthquakes Edition" Banner
Carousel Banner for the "Meet the USGS Interns - Earthquakes Edition" video pointing visitors to the latest recap on intern stories at NEIC.
Carousel Banner for the "Meet the USGS Interns - Earthquakes Edition" video pointing visitors to the latest recap on intern stories at NEIC.
Group photo from 2024 GHSC Intern Symposium
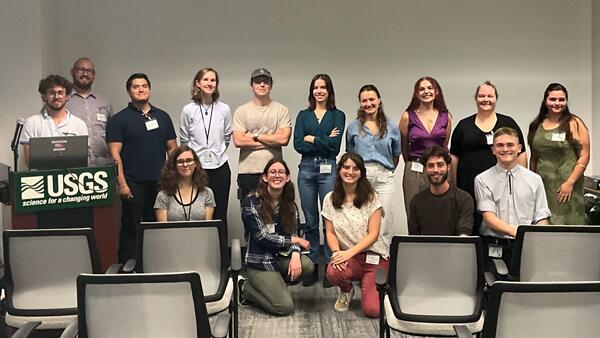
Group photo of some of the intern presenters from the 2024 GHSC Annual Intern Research Symposium.
Group photo of some of the intern presenters from the 2024 GHSC Annual Intern Research Symposium.

Video Thumbnail for the video "USGS NEIC Earthquake Response"
Video Thumbnail for the video "USGS NEIC Earthquake Response". Showcases three USGS scientists working at the National Earthquakes Information Center.
Video Thumbnail for the video "USGS NEIC Earthquake Response". Showcases three USGS scientists working at the National Earthquakes Information Center.

ShakeMap of 1906 San Francisco Earthquake
ShakeMap of 1906 San Francisco Earthquake constructed using historical data. Compare to Macroseismic data version.
ShakeMap of 1906 San Francisco Earthquake constructed using historical data. Compare to Macroseismic data version.

ShakeMap of 1906 San Francisco Earthquake with Macroseismic data
ShakeMap of 1906 San Francisco Earthquake constructed using historical macroseismic data. Compare with one without Macroseismic data version.
ShakeMap of 1906 San Francisco Earthquake constructed using historical macroseismic data. Compare with one without Macroseismic data version.

2024 Pedersen Lagoon Landslide Seismic Signals
Seismic signals from the August 7, 2024 Pedersen Lagoon (Alaska) tsunamigenic landslide recorded on seismic station AK.SWD, located approximately 30 km from the landslide location. Three directions of ground motion are shown. The landslide signal is followed by a long-duration, resonating signal characteristic of a seiche in the lagoon.
Seismic signals from the August 7, 2024 Pedersen Lagoon (Alaska) tsunamigenic landslide recorded on seismic station AK.SWD, located approximately 30 km from the landslide location. Three directions of ground motion are shown. The landslide signal is followed by a long-duration, resonating signal characteristic of a seiche in the lagoon.

2024 Pedersen Lagoon Landslide Overview Map
Overview map and location of the landslide-generated tsunami event within Alaska (inset) and Kenai Fjords National Park.
Overview map and location of the landslide-generated tsunami event within Alaska (inset) and Kenai Fjords National Park.

2024 Pedersen Lagoon Landslide Location Map
Map showing location of landslide initiation for the 2024 Pedersen Lagoon Landslide (yellow circle), approximate travel path to water (black dotted line with arrow), and preliminary estimates of tsunami height.
Map showing location of landslide initiation for the 2024 Pedersen Lagoon Landslide (yellow circle), approximate travel path to water (black dotted line with arrow), and preliminary estimates of tsunami height.

2024 Pedersen Lagoon Landslide Sentinel 2 NIR Time-Lapse GIF
Animation of Sentinel-2 near-infrared (NIR) satellite images from 19 July, 27 July, and 9 August 2024, showing landslide-generated tsunami. Increase in dark/black areas on the land on 9 August show the extent of damage from the tsunami.
Animation of Sentinel-2 near-infrared (NIR) satellite images from 19 July, 27 July, and 9 August 2024, showing landslide-generated tsunami. Increase in dark/black areas on the land on 9 August show the extent of damage from the tsunami.

2024 Pedersen Lagoon Landslide Before/After Imagery Gif
Animation of satellite images from the 4 August and 9 August, 2024, showing the extent of vegetation damage due to the landslide-generated tsunami.
Animation of satellite images from the 4 August and 9 August, 2024, showing the extent of vegetation damage due to the landslide-generated tsunami.

Yabucoa, Puerto Rico Landslide Monitoring Station
USGS scientists Bill Schulz and Mason Einbund collaborate with University of Puerto Rico-Mayagüez professor Stephen Hughes at Yabucoa, Puerto Rico landslide monitoring station.
USGS scientists Bill Schulz and Mason Einbund collaborate with University of Puerto Rico-Mayagüez professor Stephen Hughes at Yabucoa, Puerto Rico landslide monitoring station.

Meet USGS Interns: Earthquakes Edition (video thumbnail)
Thumbnail image of submitted "Meet the USGS Interns: Earthquakes Edition" video. See submission for more details.
Thumbnail image of submitted "Meet the USGS Interns: Earthquakes Edition" video. See submission for more details.

Figure4SeismicCopper.png
World map of expected annual disruption of copper refinery production, in metric tons, from potential seismic activity.
World map of expected annual disruption of copper refinery production, in metric tons, from potential seismic activity.