
USGS Geographic Information Systems (GIS) Educational Resources
Happy GIS Day!
Learn how scientists at the USGS Wetland and Aquatic Research Center use GIS to visualize and understand the Earth's surface
Interested in GIS-related educational materials and activties?
USGS EROS offers games, videos, and other activities to use in the classroom or at home.
USGS knows a thing or two about maps
Learn more about the USGS's long-running National Geospatial Program
Each year, on November 20, we celebrate this powerful capability that allows us to better understand the world around us. At the USGS WARC, we rely heavily on our expertise and capabilities in geographic information systems (also known as GIS) to help inform natural resource issues in wetland and aquatic ecosystems.
What is GIS?
Geographic Information Systems, or GIS, is a technology used to manipulate, analyze, and display geographic data inside a digital computer-based map. The system uses computer software, hardware, and geographic data, and let us better visualize geospatial information.
GIS helps us to better understand the world around us. It allows us to measure and analyze features on the earth, informs urban planning and natural disaster response, and provides navigation and mapping worldwide. The applications of GIS in the world are limitless, though it is used heavily in earth science, biology, and resource management.

Every feature on the planet has a corresponding latitude and longitude. GIS software uses mathematical interpretations to help us visualize where things are located. For example, when you navigate to a location using your phone, the GIS uses latitude and longitude to provide a route, accounting for features and traffic conditions.
GIS Data Types
Data in GIS can be represented as vector and raster.
If data is a point, line, or polygon, it is considered vector.
- For example, a map on your phone likely uses points to identify cities, lines to represent roads, and polygons to represent bodies of water.
If data consists of grid cells, or pixels, it is raster.
- Raster data is often used to illustrate variables that are quantifiable, such as rainfall or elevation.
- Raster data can be continuous (one grid cell represents a gradually changing value, such as a temperature map) or discrete (one grid cell represents a distinct value or category, such as a landcover map).

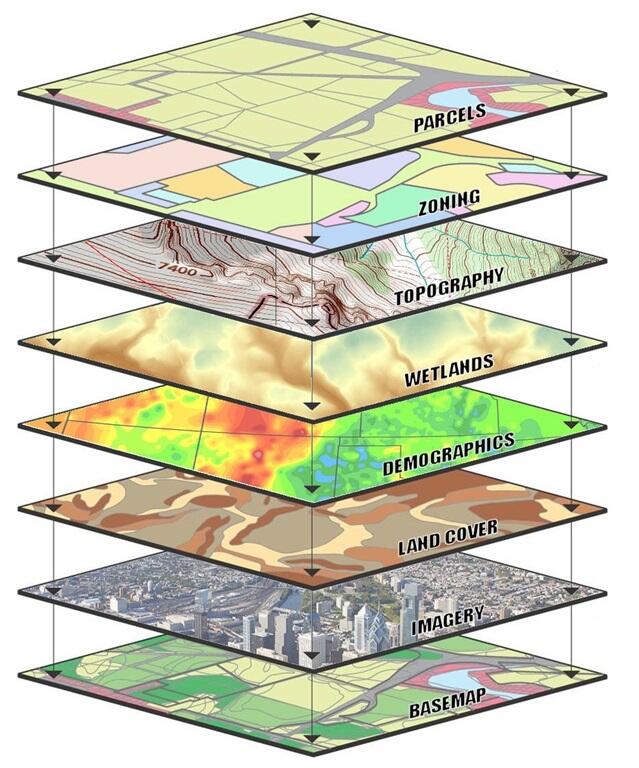
Multiple datasets, or layers, can be added to one map in GIS to better visualize how they relate to each other. For example, a map might show habitat types overlain with an animal's movement patterns, allowing USGS researchers to study high-use areas, information that can be used to inform land and species management.
Remote Sensing
Remote sensing is the process of detecting and monitoring the physical characteristics of an area by measuring its reflected and emitted radiation at a distance (typically from satellite or aircraft). Remotely sensed images are captured by special cameras that can be attached to satellites orbiting the Earth, airplanes, and uncrewed aerial systems (UAS).
USGS scientists specialize in a form of remote sensing that records information from different parts of the electromagnetic spectrum in the form of digital imagery. The image processing in computer software is then used to turn that data into useful information about the world around us.
The electromagnetic spectrum describes different types of energy which travel in waves and is made up of both visible light which can be seen by the human eye, and those which we depend on sensors to detect such as radio waves, microwaves, infrared, ultraviolet, x-ray, and gamma waves. When you listen to your radio, watch your TV, send a text message, or pop popcorn in the microwave, you are using this energy.
Satellites circle the Earth several times a day. If an electromagnetic camera sensor is placed on the satellite, it can record light reflectance measurements of the earth as it moves. The imagery comes to us in the form of pixels grouped together to form an image. Each pixel contains reflectance information broken up into bands within the electromagnetic spectrum. These reflectance values act as fingerprints helping to identify different objects on the earth. Every object on the earth absorbs and reflects light differently. USGS scientists use those reflectance values to help aid us in our research.

LiDAR
Light Detection and Ranging (LiDAR) is a remote sensing technique that uses a laser to measure distances and create three dimensional raster models of the Earth's surface. These datasets are used in the study of topography, which is the study of the shape of the land's surface.
Applications of LiDAR in science include flood modeling, land-surface mapping, landslide and volcano hazards mapping, and forest canopy studies.

On the image below, drag the arrow left and right.
On left, an example of a lidar image created from the “point cloud” that shows objects’ reflectivity near the Santa Cruz Beach Boardwalk and the mouth of the San Lorenzo River. On right, a digital still image overlaid onto the lidar “point cloud” data gives it a realistic 3D look.


Bathymetry: The Study of Underwater Terrain
Bathymetry is much like topography; however, while topography focuses on terrestrial terrain, bathymetry is the study of terrain and features underwater.
Bathymetric data is collected using sensors, such as multibeam side-scan sonar systems.
Applications of bathymetry data in science including studies of hydrography, tides, currents, and coastal flooding.
USGS also uses multibeam bathymetry to map the seafloor, especially in deepwater areas that have not yet been explored.

How does WARC use GIS?
Almost every WARC project incorporates GIS in some form. Explore examples of how we use LiDAR, remote sensing, and bathymetry to address natural resource issues in wetland and aquatic ecosystems.
Creating habitat and land-water data from imagery for wetland restoration projects in coastal Louisiana
Analyses are repeated over a 20 year period to assess wetland restoration efforts
Using remote sensing to analyze long-term impacts of the Deepwater Horizon oil spill on barrier island habitats
Habitat mapping helps target areas in most need of restoration, which can in turn benefit wildlife, such as shorebirds, migratory birds, and sea turtles.
Understanding avian habitat availability and use after barrier island restoration on coastal Louisiana
WARC and partners are surveying bird species before, during, and after restoration to determine how patterns of distribution, abundance and behavior have changed.
Tracking the movement of protected sea turtle species
Satellite tags provide WARC researchers important information on the aquatic animals' movement and habitat use patterns
Identifying where invasive species are - and where they may go next
Radio-tagged Burmese pythons help WARC and partners understand current habitat use and create habitat suitability models
Using Uncrewed Aerial Systems (UAS) to help assess habitat condition for species of interest
High-resolution imagery documents land and water fragmentation, degradation, and distribution in habitat that is critical for mottled ducks, a species of concern in Texas and Louisiana
GIS Careers at USGS WARC
What does a GIS specialist do?
The applications of GIS are limitless. Sectors such as business, natural resource management, environmental science, technology, emergency management, urban planning, telecommunications, transportation planning, military, public health, agriculture, energy, real estate, and banking all make use of GIS. It can be found everywhere in local, state, and federal government agencies as well as the private industry. Most work is indoors but some may involve field work to collect, survey, or verify data.
GIS specialists collect data, analyze the data in a mapping software, create maps which can be used in reports, maintain databases of geospatial information, and perform research.
Most GIS specialists pursued a bachelor’s degree in geography, cartography, or environmental science. Many have specializations in topics like programing, coding, surveying, or remote sensing.

Many scientists in USGS and other DOI agencies use GIS in their jobs
Cartographer
Geographer
Ecologist
Natural Resource Specialist
Wildlife Biologist
Physical Scientist
Fish Biologist
Below are examples of WARC projects that incorporate GIS

Sturgeon Occurrence and Behavior in the Outer Continental Shelf

Developing General Coastal Vegetation Maps for Coastal Morphodynamic Models

Fine-Scale Dive Profiles and Activity Patterns of Sea Turtles in the Gulf

Barrier Island Habitat Mapping for the Louisiana Outer Coast Project

Geospatial Analysis and Data Collection along the U.S. – Mexico Border

Monitoring and Adaptive Management Plan for Deepwater Horizon Natural Resource Damage Assessment (NRDA) Project: Large-scale Marsh Creation – Upper Barataria Component

Characterization of Benthic Habitats on the Pacific Margin: Assessing the Connectivity of Hard Substrates, Seeps and Canyon Communities

Quantifying Changes in Wetland Area and Habitat Types in the Deepwater Horizon Louisiana Restoration Area 1985-Present with Remote Sensing

Natural Resource Damage Assessment (NRDA) Program-Louisiana Outer Coast Restoration: North Breton Island Component-Monitoring and Adaptive Management

Geospatially Enabled, Web-based Groundwater Information Tool for Utah

Mapping High Marsh along the Northern Gulf Coast

Using Unmanned Aerial Systems (UAS) Capabilities to Help Identify Giant Salvinia (Salvinia molesta) and the effects of Salvinia weevil (Cyrtogagous salviniae)
Each year, on November 20, we celebrate this powerful capability that allows us to better understand the world around us. At the USGS WARC, we rely heavily on our expertise and capabilities in geographic information systems (also known as GIS) to help inform natural resource issues in wetland and aquatic ecosystems.
What is GIS?
Geographic Information Systems, or GIS, is a technology used to manipulate, analyze, and display geographic data inside a digital computer-based map. The system uses computer software, hardware, and geographic data, and let us better visualize geospatial information.
GIS helps us to better understand the world around us. It allows us to measure and analyze features on the earth, informs urban planning and natural disaster response, and provides navigation and mapping worldwide. The applications of GIS in the world are limitless, though it is used heavily in earth science, biology, and resource management.
Every feature on the planet has a corresponding latitude and longitude. GIS software uses mathematical interpretations to help us visualize where things are located. For example, when you navigate to a location using your phone, the GIS uses latitude and longitude to provide a route, accounting for features and traffic conditions.
GIS Data Types
Data in GIS can be represented as vector and raster.
If data is a point, line, or polygon, it is considered vector.
- For example, a map on your phone likely uses points to identify cities, lines to represent roads, and polygons to represent bodies of water.
If data consists of grid cells, or pixels, it is raster.
- Raster data is often used to illustrate variables that are quantifiable, such as rainfall or elevation.
- Raster data can be continuous (one grid cell represents a gradually changing value, such as a temperature map) or discrete (one grid cell represents a distinct value or category, such as a landcover map).
Multiple datasets, or layers, can be added to one map in GIS to better visualize how they relate to each other. For example, a map might show habitat types overlain with an animal's movement patterns, allowing USGS researchers to study high-use areas, information that can be used to inform land and species management.
Remote Sensing
Remote sensing is the process of detecting and monitoring the physical characteristics of an area by measuring its reflected and emitted radiation at a distance (typically from satellite or aircraft). Remotely sensed images are captured by special cameras that can be attached to satellites orbiting the Earth, airplanes, and uncrewed aerial systems (UAS).
USGS scientists specialize in a form of remote sensing that records information from different parts of the electromagnetic spectrum in the form of digital imagery. The image processing in computer software is then used to turn that data into useful information about the world around us.
The electromagnetic spectrum describes different types of energy which travel in waves and is made up of both visible light which can be seen by the human eye, and those which we depend on sensors to detect such as radio waves, microwaves, infrared, ultraviolet, x-ray, and gamma waves. When you listen to your radio, watch your TV, send a text message, or pop popcorn in the microwave, you are using this energy.
Satellites circle the Earth several times a day. If an electromagnetic camera sensor is placed on the satellite, it can record light reflectance measurements of the earth as it moves. The imagery comes to us in the form of pixels grouped together to form an image. Each pixel contains reflectance information broken up into bands within the electromagnetic spectrum. These reflectance values act as fingerprints helping to identify different objects on the earth. Every object on the earth absorbs and reflects light differently. USGS scientists use those reflectance values to help aid us in our research.
LiDAR
Light Detection and Ranging (LiDAR) is a remote sensing technique that uses a laser to measure distances and create three dimensional raster models of the Earth's surface. These datasets are used in the study of topography, which is the study of the shape of the land's surface.
Applications of LiDAR in science include flood modeling, land-surface mapping, landslide and volcano hazards mapping, and forest canopy studies.
On the image below, drag the arrow left and right.
On left, an example of a lidar image created from the “point cloud” that shows objects’ reflectivity near the Santa Cruz Beach Boardwalk and the mouth of the San Lorenzo River. On right, a digital still image overlaid onto the lidar “point cloud” data gives it a realistic 3D look.
Bathymetry: The Study of Underwater Terrain
Bathymetry is much like topography; however, while topography focuses on terrestrial terrain, bathymetry is the study of terrain and features underwater.
Bathymetric data is collected using sensors, such as multibeam side-scan sonar systems.
Applications of bathymetry data in science including studies of hydrography, tides, currents, and coastal flooding.
USGS also uses multibeam bathymetry to map the seafloor, especially in deepwater areas that have not yet been explored.
How does WARC use GIS?
Almost every WARC project incorporates GIS in some form. Explore examples of how we use LiDAR, remote sensing, and bathymetry to address natural resource issues in wetland and aquatic ecosystems.
Creating habitat and land-water data from imagery for wetland restoration projects in coastal Louisiana
Analyses are repeated over a 20 year period to assess wetland restoration efforts
Using remote sensing to analyze long-term impacts of the Deepwater Horizon oil spill on barrier island habitats
Habitat mapping helps target areas in most need of restoration, which can in turn benefit wildlife, such as shorebirds, migratory birds, and sea turtles.
Understanding avian habitat availability and use after barrier island restoration on coastal Louisiana
WARC and partners are surveying bird species before, during, and after restoration to determine how patterns of distribution, abundance and behavior have changed.
Tracking the movement of protected sea turtle species
Satellite tags provide WARC researchers important information on the aquatic animals' movement and habitat use patterns
Identifying where invasive species are - and where they may go next
Radio-tagged Burmese pythons help WARC and partners understand current habitat use and create habitat suitability models
Using Uncrewed Aerial Systems (UAS) to help assess habitat condition for species of interest
High-resolution imagery documents land and water fragmentation, degradation, and distribution in habitat that is critical for mottled ducks, a species of concern in Texas and Louisiana
GIS Careers at USGS WARC
What does a GIS specialist do?
The applications of GIS are limitless. Sectors such as business, natural resource management, environmental science, technology, emergency management, urban planning, telecommunications, transportation planning, military, public health, agriculture, energy, real estate, and banking all make use of GIS. It can be found everywhere in local, state, and federal government agencies as well as the private industry. Most work is indoors but some may involve field work to collect, survey, or verify data.
GIS specialists collect data, analyze the data in a mapping software, create maps which can be used in reports, maintain databases of geospatial information, and perform research.
Most GIS specialists pursued a bachelor’s degree in geography, cartography, or environmental science. Many have specializations in topics like programing, coding, surveying, or remote sensing.
Many scientists in USGS and other DOI agencies use GIS in their jobs
Cartographer
Geographer
Ecologist
Natural Resource Specialist
Wildlife Biologist
Physical Scientist
Fish Biologist
Below are examples of WARC projects that incorporate GIS