
Science crew aboard R/V Marcus G. Langseth. Ray Sliter (Pacific Coastal and Marine Science Center) and Deb Hutchison (Woods Hole Coastal and Marine Science Center) shown at far left.
Images
Woods Hole Coastal and Marine Science Center images
Filter Total Items: 1090

Science crew aboard R/V Marcus G. Langseth.
Science crew aboard R/V Marcus G. Langseth. Ray Sliter (Pacific Coastal and Marine Science Center) and Deb Hutchison (Woods Hole Coastal and Marine Science Center) shown at far left.

Map of distribution of substrate mud content, Stellwagen Bank
Map of distribution of substrate mud content, Stellwagen Bank
Map of distribution of substrate mud content, Stellwagen Bank
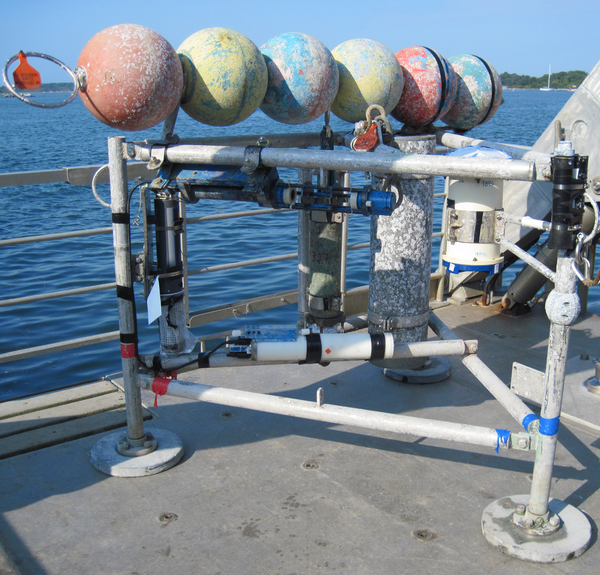
Minipod style tripod for near bottom current and wave measurements
Minipod style tripod for near bottom current and wave measurements ready for deployment.
Minipod style tripod for near bottom current and wave measurements ready for deployment.

Deploying multibeam sonar
USGS staff and the ship's crew of the R/V Sharp prepare to deploy a deep-water multibeam echosounder during a mapping program in the mid-Atlantic in 2015.
USGS staff and the ship's crew of the R/V Sharp prepare to deploy a deep-water multibeam echosounder during a mapping program in the mid-Atlantic in 2015.

Map of daily-averaged ocean surface current data
Map of daily-averaged ocean surface current data integrated from multiple IOOS Partner forecast models
Map of daily-averaged ocean surface current data integrated from multiple IOOS Partner forecast models

Illustration of the NIMBBLE (New instrument for making bottom boun
Illustration of the NIMBBLE (New instrument for making bottom boundary layer evaluations). The NIMBBLE is a low-profile platform with two acoustic Doppler velocimeters and an upward-looking acoustic Doppler profilers.
Illustration of the NIMBBLE (New instrument for making bottom boundary layer evaluations). The NIMBBLE is a low-profile platform with two acoustic Doppler velocimeters and an upward-looking acoustic Doppler profilers.

Juncus Marsh
Photograph of a Juncus marsh in the Tampa Bay estuary, Florida.
Photograph of a Juncus marsh in the Tampa Bay estuary, Florida.

Map showing the change in modern sediment thickness Fire Island, NY
Map showing the change in modern sediment thickness in meters between 1996-1997 and 2011 offshore of Fire Island. Green areas indicate accretion and red a
Map showing the change in modern sediment thickness in meters between 1996-1997 and 2011 offshore of Fire Island. Green areas indicate accretion and red a

UAS Pilot Training
USGS pilot Sandy Brosnahan and Senate Pro Tempore Marc Pacheco discuss the use of Umanned Aerial Systems (UASs, also known as drones) to collect data in coastal environments. Photo credit: Dann Blackwood, USGS.
USGS pilot Sandy Brosnahan and Senate Pro Tempore Marc Pacheco discuss the use of Umanned Aerial Systems (UASs, also known as drones) to collect data in coastal environments. Photo credit: Dann Blackwood, USGS.

Hudson Shelf Valley Study Site
Bathymetry and backscatter intensity of the sea floor of the Hudson Shelf Valley location map
Bathymetry and backscatter intensity of the sea floor of the Hudson Shelf Valley location map

Measuring seagrass!
Measuring seagrass biomass in Chincoteague Bay, Maryland to constrain numerical models.
Measuring seagrass biomass in Chincoteague Bay, Maryland to constrain numerical models.

Map showing the tracklines and grab sample sites of the 2014 and 2015
Map showing the tracklines and grab sample sites of the 2014 and 2015 geophysical surveys offshore of the Delmarva Peninsula.
Map showing the tracklines and grab sample sites of the 2014 and 2015 geophysical surveys offshore of the Delmarva Peninsula.

Storm erosion at Chincoteague Bay, MD
Storm induced erosion of marsh shorelines can provide significant quantities of sediment to the bay altering the deposition patterns.
Storm induced erosion of marsh shorelines can provide significant quantities of sediment to the bay altering the deposition patterns.

Data Processing Center on the M/V Scarlett Isabella
Woods Hole Coastal and Marine Science Center personnel process data in the dry lab on the M/V Scarlett Isabella
Woods Hole Coastal and Marine Science Center personnel process data in the dry lab on the M/V Scarlett Isabella

Flood tidal shoal
Flood tidal shoal at Barnegat Inlet, New Jersey (courtesy USGS EROS NAIP orthophotography)
Flood tidal shoal at Barnegat Inlet, New Jersey (courtesy USGS EROS NAIP orthophotography)

Inundated Marsh
Inundated marsh at Forsythe National Wildlife Refuge, New Jersey.
Inundated marsh at Forsythe National Wildlife Refuge, New Jersey.

Collecting Samples in Barnegat Bay
Box-cores provide a relatively undistributed look into the recent past to help better understand the processes contributing to sediment deposition and erosion.
Box-cores provide a relatively undistributed look into the recent past to help better understand the processes contributing to sediment deposition and erosion.

Deck of M/V Scarlett Isabella
Deck shot of M/V Scarlett Isabella

Barnegat Bay, NJ Surface Sediments
Surface sediments will be analyzed for various physical parameters that will be used as initial conditions in hydrodynamic and sediment transport models.
Surface sediments will be analyzed for various physical parameters that will be used as initial conditions in hydrodynamic and sediment transport models.

Sunset on Delmarva Peninsula
Sunset on the Delmarva Peninsula

Gulf of Mexico
A GIS compilation of Updated Vector Shorelines and Associated Shoreline Change Data for the Gulf of Mexico Coast
A GIS compilation of Updated Vector Shorelines and Associated Shoreline Change Data for the Gulf of Mexico Coast