
Scientists collect soil cores in coastal wetland by removing a section of peat, the organic-rich material that makes up salt marshes. After the soil is removed, water quickly fills in the void. This water-logged environment underground is devoid of oxygen and is an important reason that salt marsh peat preserves a record of historical changes.
Images
Woods Hole Coastal and Marine Science Center images
Filter Total Items: 1090

Soil core from coastal wetland
Scientists collect soil cores in coastal wetland by removing a section of peat, the organic-rich material that makes up salt marshes. After the soil is removed, water quickly fills in the void. This water-logged environment underground is devoid of oxygen and is an important reason that salt marsh peat preserves a record of historical changes.
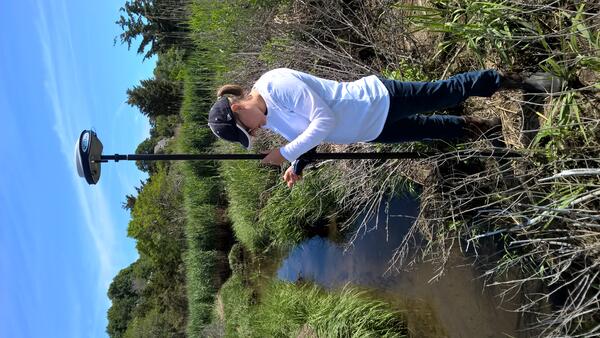
Meagan Eagle, USGS Research Scientist, collecting elevation points in Quivett Creek, Brewster, MA
linkMeagan Eagle, Research Scientists at the U.S. Geological Survey, collects an elevation point along the edge of Quivett Creek in Brewster, MA. This salt marsh was restored in 2005 by replacing a narrow culvert to allow full tidal flow once again.

Bass Creek salt marsh, Yarmouth, MA
Two USGS scientists measure elevation at Bass Creek salt marsh, Yarmouth, MA.
Two USGS scientists measure elevation at Bass Creek salt marsh, Yarmouth, MA.

Bass Creek Salt Marsh, Yarmouth, MA
Salt marsh grass grows in the restored marsh at Bass Creek, Yarmouth, MA.
Salt marsh grass grows in the restored marsh at Bass Creek, Yarmouth, MA.

Piping Plover Nest
USGS scientists are working to model shorebird habitat availability both today and in the future, given processes like sea-level rise, in an effort to support the efficient management of beaches for both people and nesting shorebirds.
USGS scientists are working to model shorebird habitat availability both today and in the future, given processes like sea-level rise, in an effort to support the efficient management of beaches for both people and nesting shorebirds.

Four airgun arrays towed behind R/V Marcus G. Langseth.
Four airgun arrays towed behind R/V Marcus G. Langseth.
Four airgun arrays towed behind R/V Marcus G. Langseth.

Barnegat Bay residence times in days
Barnegat Bay residence times in days for (a) scenario T, only tidal forcing; (b) scenario TB, combined offshore hydrodynamic forcing; (c) scenario TBR, streamflow with combined hydrodynamic forcing; and (d) scenario TBRM, full suite with meteorological forcing
Barnegat Bay residence times in days for (a) scenario T, only tidal forcing; (b) scenario TB, combined offshore hydrodynamic forcing; (c) scenario TBR, streamflow with combined hydrodynamic forcing; and (d) scenario TBRM, full suite with meteorological forcing

Deploying the 8-km long streamer from R/V Marcus G. Langseth.
Deploying the 8-km long streamer from R/V Marcus G. Langseth.
Deploying the 8-km long streamer from R/V Marcus G. Langseth.

R/V Marcus G. Langseth in port in Charleston, SC.
R/V Marcus G. Langseth in port in Charleston, SC.
R/V Marcus G. Langseth in port in Charleston, SC.

Sandwich Town Neck Beach composite aerial view
Composite aerial view of Sandwich Town Neck Beach. The imagery was obtained from an unmanned aerial system (UAS) flown by Peter Traykovski in February, 2015, a few days after winter storm Juno. The background topography is from USGS and U.S. Army Corps of Engineers lidar data, with missing-data areas shown in white.
Composite aerial view of Sandwich Town Neck Beach. The imagery was obtained from an unmanned aerial system (UAS) flown by Peter Traykovski in February, 2015, a few days after winter storm Juno. The background topography is from USGS and U.S. Army Corps of Engineers lidar data, with missing-data areas shown in white.

Researchers pull in a cable containing underwater microphones
Rob Thieler (left), Laura Brothers, and David Foster pull in a cable containing underwater microphones after completing a seismic survey in 2014.
Rob Thieler (left), Laura Brothers, and David Foster pull in a cable containing underwater microphones after completing a seismic survey in 2014.

USGS staff and Tribal GIS workshop participants
USGS staff and Tribal GIS workshop participants
USGS staff and Tribal GIS workshop participants

Map showing distribution of physiographic zones in Buzzards Bay, MA
Map showing the distribution of physiographic zones within the Buzzards Bay study area. The physiographic zone classification is adapted from Kelley and others (1998), and the zones are delineated on the basis of sea-floor morphology and the dominant texture of surficial material.
Map showing the distribution of physiographic zones within the Buzzards Bay study area. The physiographic zone classification is adapted from Kelley and others (1998), and the zones are delineated on the basis of sea-floor morphology and the dominant texture of surficial material.

Bottom simulating reflector
Bottom simulating reflector imaged in 2014 by the USGS along a seismic line acquired south of Hudson Canyon during the Extended Continental Shelf cruise. Image provided by D. Hutchinson and reproduced from USGS Fact Sheet 3080.
Bottom simulating reflector imaged in 2014 by the USGS along a seismic line acquired south of Hudson Canyon during the Extended Continental Shelf cruise. Image provided by D. Hutchinson and reproduced from USGS Fact Sheet 3080.

R/V Marcus G. Langseth entering NY Harbor
R/V Marcus G. Langseth entering NY Harbor
R/V Marcus G. Langseth entering NY Harbor

Oceanographic Tripods on the Dock
A flow tripod (taller, right) and sonar tripod (smaller, left) at the dock before being loaded onto a ship and taken to a site off Fire Island for deployment.
A flow tripod (taller, right) and sonar tripod (smaller, left) at the dock before being loaded onto a ship and taken to a site off Fire Island for deployment.

USGS scientist measures water and sediment movement
A USGS researcher measures water and sediment movement at Forsythe National Wildlife Refuge, New Jersey.
A USGS researcher measures water and sediment movement at Forsythe National Wildlife Refuge, New Jersey.

Split-beam (EK60) sonar image of bubbles
Split-beam (EK60) sonar image of bubbles (green) in the water column at a seep site overlooking Baltimore Canyon on the U.S. Atlantic margin. Although the bubbles appear to nearly reach the sea surface, the methane contained in the bubbles would have dissolved and been replaced by other gases by the time the bubbles rise several hundred meters.
Split-beam (EK60) sonar image of bubbles (green) in the water column at a seep site overlooking Baltimore Canyon on the U.S. Atlantic margin. Although the bubbles appear to nearly reach the sea surface, the methane contained in the bubbles would have dissolved and been replaced by other gases by the time the bubbles rise several hundred meters.

Multi-channel seismic data preview image
Preview image of multi-channel seismic data collected by the USGS off the US Seaboard Atlantic as part of the US Extended Continental Shelf project.
Preview image of multi-channel seismic data collected by the USGS off the US Seaboard Atlantic as part of the US Extended Continental Shelf project.

Inundated Marsh
Inundated marsh at Forsythe National Wildlife Refuge, New Jersey.
Inundated marsh at Forsythe National Wildlife Refuge, New Jersey.

Hydrodynamic Model
Visualization of hydrodynamics around seagrass patch.
Visualization of hydrodynamics around seagrass patch.