
USGS scientists Kate Allstadt and Cynthia Gardner tell the story of the May 18, 1980 eruption of Mount St. Helens and how the catastrophic landslide, lateral blast, and lahar changed the landscape.
Images
Images intro.
Filter Total Items: 7147

USGS scientist and GeoGirls viewing Mount St. Helens
USGS scientists Kate Allstadt and Cynthia Gardner tell the story of the May 18, 1980 eruption of Mount St. Helens and how the catastrophic landslide, lateral blast, and lahar changed the landscape.

Yellowstone subsurface cross-section schematic oriented SW-NE, depi...
Yellowstone subsurface cross-section schematic oriented SW-NE, depicts rise of magma beneath mantle plus heating and movement of mantle and crustal material. Credit Univ Utah. Click to enlarge.
Yellowstone subsurface cross-section schematic oriented SW-NE, depicts rise of magma beneath mantle plus heating and movement of mantle and crustal material. Credit Univ Utah. Click to enlarge.

Newberry Volcano's Youngest Lava Flows
Newberry Volcano's youngest lava flows. Source: Robinson, J.E., Donnelly-Nolan, J.M., and Jensen, R.A., 2015, Newberry Volcano’s Youngest Lava Flows: U.S. Geological Survey Scientific Investigations Map 3329, 1 sheet, https://dx.doi.org/10.3133/sim3329.
Newberry Volcano's youngest lava flows. Source: Robinson, J.E., Donnelly-Nolan, J.M., and Jensen, R.A., 2015, Newberry Volcano’s Youngest Lava Flows: U.S. Geological Survey Scientific Investigations Map 3329, 1 sheet, https://dx.doi.org/10.3133/sim3329.

Kīlauea's ERZ eruption turns 33!
The November 25, 2015, breakout that began as a rupture from the tube supplying the June 27th lava flow advanced slowly to the northeast of Pu‘u ‘Ō‘ō (background) and reached the forest in mid-December, but still poses no immediate threat to Puna communities. USGS image.
The November 25, 2015, breakout that began as a rupture from the tube supplying the June 27th lava flow advanced slowly to the northeast of Pu‘u ‘Ō‘ō (background) and reached the forest in mid-December, but still poses no immediate threat to Puna communities. USGS image.

Woods Hole Coastal and Marine Science Center
Woods Hole Coastal and Marine Science Center side entrance to the Tilley Conference Room
Woods Hole Coastal and Marine Science Center side entrance to the Tilley Conference Room

Lights! Camera! Action!
Dr. Laura Brothers preparing to collect visual imagery aboard the RV Rafael as part of the launch of the MiniSEABOSS while doing work off of Nantucket. The MiniSEABOSS collects samples, photos and video of the seafloor.
Dr. Laura Brothers preparing to collect visual imagery aboard the RV Rafael as part of the launch of the MiniSEABOSS while doing work off of Nantucket. The MiniSEABOSS collects samples, photos and video of the seafloor.

Special Delivery
Sandy Brosnahan transporting a weather buoy into the Woods Hole Coastal and Marine Science Center’s operational facility in preparation for deployment. This buoy was one of 6 deployed to measure wind speed, direction, pressure, and temperature off the coast of Fire Island, NY.
Sandy Brosnahan transporting a weather buoy into the Woods Hole Coastal and Marine Science Center’s operational facility in preparation for deployment. This buoy was one of 6 deployed to measure wind speed, direction, pressure, and temperature off the coast of Fire Island, NY.

Science crew aboard R/V Marcus G. Langseth.
Science crew aboard R/V Marcus G. Langseth. Ray Sliter (Pacific Coastal and Marine Science Center) and Deb Hutchison (Woods Hole Coastal and Marine Science Center) shown at far left.
Science crew aboard R/V Marcus G. Langseth. Ray Sliter (Pacific Coastal and Marine Science Center) and Deb Hutchison (Woods Hole Coastal and Marine Science Center) shown at far left.

Map of distribution of substrate mud content, Stellwagen Bank
Map of distribution of substrate mud content, Stellwagen Bank
Map of distribution of substrate mud content, Stellwagen Bank
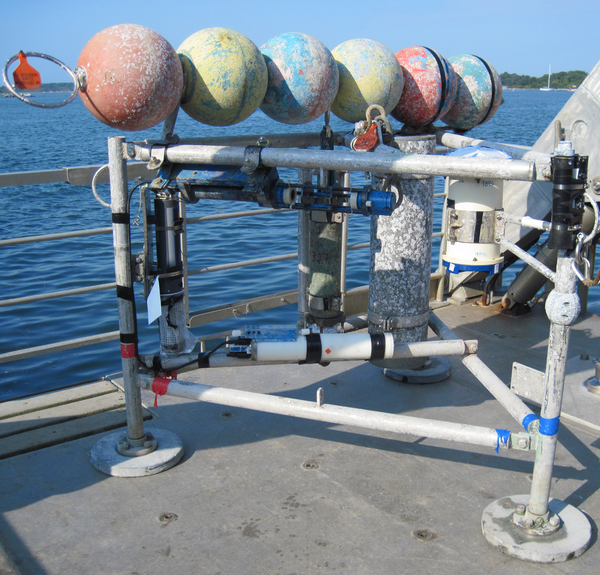
Minipod style tripod for near bottom current and wave measurements
Minipod style tripod for near bottom current and wave measurements ready for deployment.
Minipod style tripod for near bottom current and wave measurements ready for deployment.

Calyptogena spp. in Alaska
These clams (Calyptogena spp.) were discovered in about 1000 meter-deep waters off the southern tip of Alaska near a 250-meter-high cone rising from the seafloor and 10 kilometers from the Queen Charlotte-Fairweather fault.
These clams (Calyptogena spp.) were discovered in about 1000 meter-deep waters off the southern tip of Alaska near a 250-meter-high cone rising from the seafloor and 10 kilometers from the Queen Charlotte-Fairweather fault.

Deploying multibeam sonar
USGS staff and the ship's crew of the R/V Sharp prepare to deploy a deep-water multibeam echosounder during a mapping program in the mid-Atlantic in 2015.
USGS staff and the ship's crew of the R/V Sharp prepare to deploy a deep-water multibeam echosounder during a mapping program in the mid-Atlantic in 2015.

Sunset Crater is the youngest cinder cone of the San Francisco Volcanic Field in Northern Arizona.
linkEruptions between 1064 and 1067 AD produced three lava flows that covered 8 km2 (3 mi2) and a field of scoria and spatter that covers 2300 km2 (890 mi2). Archeological evidence shows that there were communities of people living in the area who were impacted by the eruption.

Map of daily-averaged ocean surface current data
Map of daily-averaged ocean surface current data integrated from multiple IOOS Partner forecast models
Map of daily-averaged ocean surface current data integrated from multiple IOOS Partner forecast models

Illustration of the NIMBBLE (New instrument for making bottom boun
Illustration of the NIMBBLE (New instrument for making bottom boundary layer evaluations). The NIMBBLE is a low-profile platform with two acoustic Doppler velocimeters and an upward-looking acoustic Doppler profilers.
Illustration of the NIMBBLE (New instrument for making bottom boundary layer evaluations). The NIMBBLE is a low-profile platform with two acoustic Doppler velocimeters and an upward-looking acoustic Doppler profilers.

Photo showing complex geomorphology of the Grand Bay marsh landscape
Photo showing the complex geomorphology of the marsh landscape of the Grand Bay National Wildlife Refuge/Grand Bay National Estuarine Research Reserve in coastal Alabama and Mississippi. (1) Geology—a tidal creek that at lower sea level than present served as a distributary channel of a river-delta system. (2) Hydrodynamics—wave erosion of the marsh edge.
Photo showing the complex geomorphology of the marsh landscape of the Grand Bay National Wildlife Refuge/Grand Bay National Estuarine Research Reserve in coastal Alabama and Mississippi. (1) Geology—a tidal creek that at lower sea level than present served as a distributary channel of a river-delta system. (2) Hydrodynamics—wave erosion of the marsh edge.

Queen Charlotte-Fairweather fault
Enlarged details of Survey Area 1 showing new multibeam bathymetry data (rainbow colors) acquired on R/V Solstice near Cross Sound and Glacier Bay National Park, southeastern Alaska. Arrows highlight the surface expression, or trace, of the Queen Charlotte-Fairweather fault.
Enlarged details of Survey Area 1 showing new multibeam bathymetry data (rainbow colors) acquired on R/V Solstice near Cross Sound and Glacier Bay National Park, southeastern Alaska. Arrows highlight the surface expression, or trace, of the Queen Charlotte-Fairweather fault.

Yakobi Sea Valley
Enlarged from previous figure, this map shows a string of basins along the fault and offset of the south wall of the Yakobi Sea Valley. Line A–B marks the location of multichannel seismic-reflection profile.
Enlarged from previous figure, this map shows a string of basins along the fault and offset of the south wall of the Yakobi Sea Valley. Line A–B marks the location of multichannel seismic-reflection profile.

Multichannel seismic-reflection profile
Multichannel seismic-reflection profile showing sediment layers beneath the seafloor disrupted by the Queen Charlotte-Fairweather fault near Cross Sound. The profile is approximately 16 kilometers across, and it extends approximately 370 meters beneath the seafloor. See related multimedia below, for the location of this profile.
Multichannel seismic-reflection profile showing sediment layers beneath the seafloor disrupted by the Queen Charlotte-Fairweather fault near Cross Sound. The profile is approximately 16 kilometers across, and it extends approximately 370 meters beneath the seafloor. See related multimedia below, for the location of this profile.

Sidescan sonar record off so. Alaska
Profile of newly discovered volcano-like cone in sonar record collected off southern Alaska. The cone’s summit is at about 1,000 meters water depth. Note fluid plume (blue) rising more than 700 meters upward from the summit.
Profile of newly discovered volcano-like cone in sonar record collected off southern Alaska. The cone’s summit is at about 1,000 meters water depth. Note fluid plume (blue) rising more than 700 meters upward from the summit.

Seafloor trace of the Queen Charlotte-Fairweather fault
Seafloor trace of the Queen Charlotte-Fairweather fault (from top left to bottom right) offsets the edge of the Yakobi Sea Valley off southeast Alaska. This 700-mile-long fault has generated large earthquakes in the past. Future shocks—and tsunamis—could threaten coastal communities in the U.S. and Canada. (Color-coded depths, in meters, were mapped in 2015.)
Seafloor trace of the Queen Charlotte-Fairweather fault (from top left to bottom right) offsets the edge of the Yakobi Sea Valley off southeast Alaska. This 700-mile-long fault has generated large earthquakes in the past. Future shocks—and tsunamis—could threaten coastal communities in the U.S. and Canada. (Color-coded depths, in meters, were mapped in 2015.)