Debris-flow deposits downstream of the 2022 Pipeline Fire burn scar, north of Flagstaff, Arizona
linkDebris-flow deposits downstream of the 2022 Pipeline Fire burn scar, north of Flagstaff, Arizona.

Official websites use .gov
A .gov website belongs to an official government organization in the United States.
Secure .gov websites use HTTPS
A lock () or https:// means you’ve safely connected to the .gov website. Share sensitive information only on official, secure websites.

Debris-flow deposits downstream of the 2022 Pipeline Fire burn scar, north of Flagstaff, Arizona.
Debris-flow deposits downstream of the 2022 Pipeline Fire burn scar, north of Flagstaff, Arizona.

The R/V Sallenger tows the structure-from-motion quantitative underwater imaging device with 5 cameras (SQUID-5) across the water over Looe Key Reef in the Florida Keys.
The R/V Sallenger tows the structure-from-motion quantitative underwater imaging device with 5 cameras (SQUID-5) across the water over Looe Key Reef in the Florida Keys.

Studying Seafloor Erosion in the Florida Keys
The challenge:
Studying Seafloor Erosion in the Florida Keys
The challenge:

Mount Rainier (Washington) volcano hazard zones and estimated lahar (volcanic mudflow) arrival times for the Puyallup and Nisqually River valleys.
Mount Rainier (Washington) volcano hazard zones and estimated lahar (volcanic mudflow) arrival times for the Puyallup and Nisqually River valleys.

Cover image for video featuring Curt Storlazzi, USGS titled, "Coral Reefs as National, Natural Infrastructure"
Cover image for video featuring Curt Storlazzi, USGS titled, "Coral Reefs as National, Natural Infrastructure"

A map showing the epicenter of the M 3.5 quake that occurred 3.7 miles (6 km) east of Elgin, South Carolina on June 29, 2022. The quake is part of an ongoing sequence in central South Carolina. The sequence started on December 27, 2021, with an M3.3 earthquake near Lugoff, South Carolina.
A map showing the epicenter of the M 3.5 quake that occurred 3.7 miles (6 km) east of Elgin, South Carolina on June 29, 2022. The quake is part of an ongoing sequence in central South Carolina. The sequence started on December 27, 2021, with an M3.3 earthquake near Lugoff, South Carolina.

Illustration of NOAA research vessel conducting multibeam sonar survey of seafloor, courtesy of EXPRESS, or Expanding Pacific Research and Exploration of Submerged Systems.
Illustration of NOAA research vessel conducting multibeam sonar survey of seafloor, courtesy of EXPRESS, or Expanding Pacific Research and Exploration of Submerged Systems.

Image showing NOAA research vessel with logos of NOAA, BOEM, USGS and MBARI. EXPRESS is a multi-year, multi-institution cooperative research campaign in deep sea areas of California, Oregon, and Washington, including the continental shelf and slope.
Image showing NOAA research vessel with logos of NOAA, BOEM, USGS and MBARI. EXPRESS is a multi-year, multi-institution cooperative research campaign in deep sea areas of California, Oregon, and Washington, including the continental shelf and slope.

Restored staghorn coral (Acropora cervicornis) at Looe Key reef in the lower Florida Keys outplanted by Mote Marine Laboratory's coral restoration program.
Restored staghorn coral (Acropora cervicornis) at Looe Key reef in the lower Florida Keys outplanted by Mote Marine Laboratory's coral restoration program.

Alex Hatem observes surface deformation from the 2020 Monte Cristo, Nevada, earthquake eroding away, June, 2022.
Alex Hatem observes surface deformation from the 2020 Monte Cristo, Nevada, earthquake eroding away, June, 2022.

Our coasts, the most familiar part of the ocean are the gateway to the larger deeper ocean world. USGS studies processes and hazards in the coastal zone and how they affect people, wildlife, and ecosystems.
Our coasts, the most familiar part of the ocean are the gateway to the larger deeper ocean world. USGS studies processes and hazards in the coastal zone and how they affect people, wildlife, and ecosystems.

In June 2022, Mendenhall Fellow Sabine Loos (Research Civil Engineer in the Geological Hazards Science Center) presented a seminar to USGS's Earthquake Science Center at Moffett Field, CA, where Max Schneider (Research Statistician) works as a Mendenhall Fellow.
In June 2022, Mendenhall Fellow Sabine Loos (Research Civil Engineer in the Geological Hazards Science Center) presented a seminar to USGS's Earthquake Science Center at Moffett Field, CA, where Max Schneider (Research Statistician) works as a Mendenhall Fellow.

Rich Briggs and Alex Hatem make geologic observations within Nevada’s Monte Cristo Range, June, 2022.
Rich Briggs and Alex Hatem make geologic observations within Nevada’s Monte Cristo Range, June, 2022.
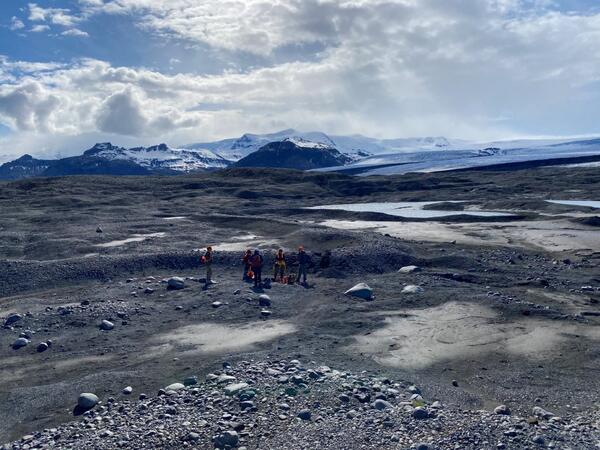
Researchers from the USGS, NASA, and NAU gather around a small simple esker and ephemeral lake deposits. The team used sedimentology, geochemistry, and remote sensing to characterize these features on Earth before comparing them to Mars.
Researchers from the USGS, NASA, and NAU gather around a small simple esker and ephemeral lake deposits. The team used sedimentology, geochemistry, and remote sensing to characterize these features on Earth before comparing them to Mars.

Our coasts, the most familiar part of the ocean are the gateway to the larger deeper ocean world. USGS studies processes and hazards in the coastal zone and how they affect people, wildlife, and ecosystems.
Our coasts, the most familiar part of the ocean are the gateway to the larger deeper ocean world. USGS studies processes and hazards in the coastal zone and how they affect people, wildlife, and ecosystems.

An erosion model activity used by the St. Petersburg Coastal and Marine Science Center to showcase how hurricane-force winds can cause damage to coastal environments.
An erosion model activity used by the St. Petersburg Coastal and Marine Science Center to showcase how hurricane-force winds can cause damage to coastal environments.

The USGS Coastal Change Hazards Portal contains an interactive map of historical shoreline positions and shoreline change rates for Puerto Rico.
The USGS Coastal Change Hazards Portal contains an interactive map of historical shoreline positions and shoreline change rates for Puerto Rico.

Trayectorias de los huracanes Hugo (1989), Georges (1998), Irma (2017) y María (2017). Datos provistos por la NOAA. La imagen de base es propiedad intelectual de Esri y se usa aquí bajo licencia. Los derechos de autor y reproducción son propiedad de Esri y sus licenciatarios.
Trayectorias de los huracanes Hugo (1989), Georges (1998), Irma (2017) y María (2017). Datos provistos por la NOAA. La imagen de base es propiedad intelectual de Esri y se usa aquí bajo licencia. Los derechos de autor y reproducción son propiedad de Esri y sus licenciatarios.

Close-up oblique views of Mount Rainier’s west side showing simulated lahar flow depths from a landslide originating in the area of the Tahoma Glacier Headwall (T-260-HM simulation). Imagery appears blurry where lahar material is absent because D-Claw’s adaptive mesh refinement (AMR) employs very coarse resolution in those areas.
Close-up oblique views of Mount Rainier’s west side showing simulated lahar flow depths from a landslide originating in the area of the Tahoma Glacier Headwall (T-260-HM simulation). Imagery appears blurry where lahar material is absent because D-Claw’s adaptive mesh refinement (AMR) employs very coarse resolution in those areas.

Fault sections being used in the creation of the 2023 U.S. Seismic Hazard Maps. Blue lines are normal faults, yellow lines are reverse faults, and red lines are strike-slip faults.
Fault sections being used in the creation of the 2023 U.S. Seismic Hazard Maps. Blue lines are normal faults, yellow lines are reverse faults, and red lines are strike-slip faults.

Noa Randall and Rachel Allen are installing an optical turbidity sensor on the mudflats in Wellfleet harbor, to pair with the altimeter run by the Center for Coastal Studies. The Herring River, which drains into Wellfleet Harbor, is slated to have its 100-yo dam removed in the next 6 months, with the potential to dramatically increase the sediment load and sus
Noa Randall and Rachel Allen are installing an optical turbidity sensor on the mudflats in Wellfleet harbor, to pair with the altimeter run by the Center for Coastal Studies. The Herring River, which drains into Wellfleet Harbor, is slated to have its 100-yo dam removed in the next 6 months, with the potential to dramatically increase the sediment load and sus