
This image created using the Continuous Bathymetry and Elevation Models of the Massachusetts Coastal Zone and Continental Shelf, shows the three-dimensional perspective view of Nantucket Island, MA looking from the Southeast to the Northwest.
Images
Images intro.
Filter Total Items: 2135

Nantucket, Massachusetts
This image created using the Continuous Bathymetry and Elevation Models of the Massachusetts Coastal Zone and Continental Shelf, shows the three-dimensional perspective view of Nantucket Island, MA looking from the Southeast to the Northwest.
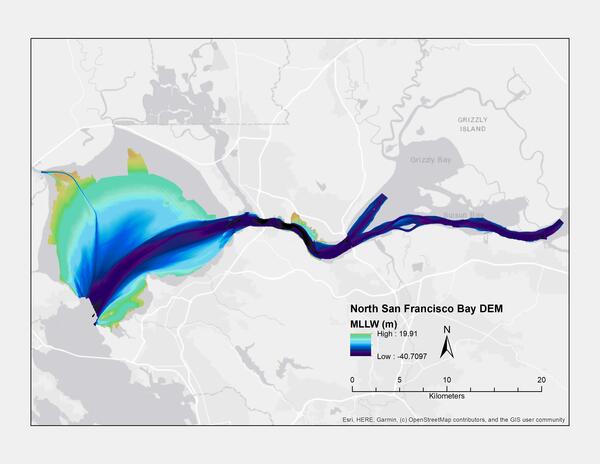
Bathymetric map of the northern portion of San Francisco Bay (MLLW)
Digital elevation model (DEM) of northern San Francisco Bay, California, created using bathymetry data collected between 1999 and 2016 (MLLW)
Digital elevation model (DEM) of northern San Francisco Bay, California, created using bathymetry data collected between 1999 and 2016 (MLLW)

California coastline
The U.S. west coast is an area of complex coastal geography. This photograph depicts several examples of geological features along the California coastline that are shaped by varied coastal processes. The gently sloping beach, stark bluffs, and presence of smooth rocks suggests that the coastal processes shaping this coastline are complex.
The U.S. west coast is an area of complex coastal geography. This photograph depicts several examples of geological features along the California coastline that are shaped by varied coastal processes. The gently sloping beach, stark bluffs, and presence of smooth rocks suggests that the coastal processes shaping this coastline are complex.

California coastal erosion
This region of the California coastline is lined with coastal bluffs that have been shaped not only by runoff from rain, but also by wave- and wind-driven erosion. This photo from Pescadero State Beach displays an example of a bluff undergoing erosional processes. Water from the ocean, delivered in waves, can overtop some of these coastal bluffs.
This region of the California coastline is lined with coastal bluffs that have been shaped not only by runoff from rain, but also by wave- and wind-driven erosion. This photo from Pescadero State Beach displays an example of a bluff undergoing erosional processes. Water from the ocean, delivered in waves, can overtop some of these coastal bluffs.

Coastal storm modeling system integrates economic impacts
Patrick Barnard explains how the Coastal Storm Modeling System (CoSMoS) integrates information from the Hazards Exposure Reporting and Analytics (HERA) mapper to understand the social and economic consequences of different flooding scenarios.
Patrick Barnard explains how the Coastal Storm Modeling System (CoSMoS) integrates information from the Hazards Exposure Reporting and Analytics (HERA) mapper to understand the social and economic consequences of different flooding scenarios.
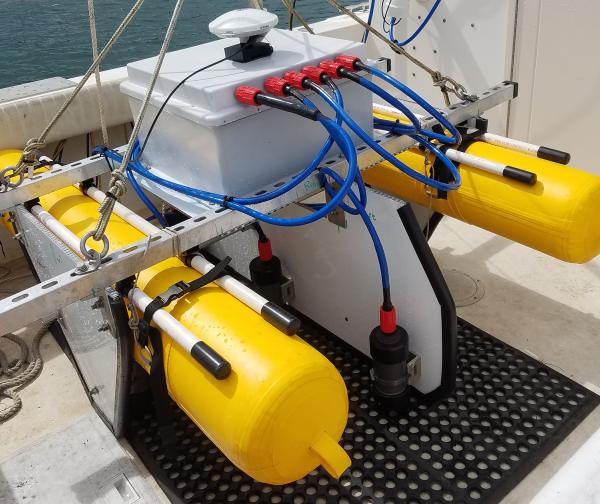
SQUID-5 - Structure-from-Motion Quantitative Underwater Imaging Device
The SQUID-5, or a Structure-from-Motion (SfM) Quantitative Underwater Imaging Device with 5 cameras is a towed surface vehicle with an onboard Global Navigation Satellite System (GNSS) and 5 downward-looking cameras with overlapping views of the seafloor.
The SQUID-5, or a Structure-from-Motion (SfM) Quantitative Underwater Imaging Device with 5 cameras is a towed surface vehicle with an onboard Global Navigation Satellite System (GNSS) and 5 downward-looking cameras with overlapping views of the seafloor.

A wave breaks over a degraded reef crest at Buck Island in St. Croix
A wave breaking over a degraded reef crest at Buck Island National Monument in St. Croix. Wave-breaking in these habitats relies on reef framework built by the elkhorn coral, Acropora palmata, which is now a threatened species throughout the western Atlantic.
A wave breaking over a degraded reef crest at Buck Island National Monument in St. Croix. Wave-breaking in these habitats relies on reef framework built by the elkhorn coral, Acropora palmata, which is now a threatened species throughout the western Atlantic.

Merrimack River, Plum Island, and Parker River Wildlife Refuge
This image created using the Continuous Bathymetry and Elevation Models of the Massachusetts Coastal Zone and Continental Shelf, shows the mouth of the Merrimack River, Plum Island and the Parker River National Wildlife Refuge.
This image created using the Continuous Bathymetry and Elevation Models of the Massachusetts Coastal Zone and Continental Shelf, shows the mouth of the Merrimack River, Plum Island and the Parker River National Wildlife Refuge.

Provincetown, MA
This image was created using the Continuous Bathymetry and Elevation Models of the Massachusetts Coastal Zone and Continental Shelf, shows Provincetown, MA and the northern section of the Cape Cod National Seashore.
This image was created using the Continuous Bathymetry and Elevation Models of the Massachusetts Coastal Zone and Continental Shelf, shows Provincetown, MA and the northern section of the Cape Cod National Seashore.

Elizabeth Islands, Vineyard Sound, and Martha’s Vineyard.
This image created using the Continuous Bathymetry and Elevation Models of the Massachusetts Coastal Zone and Continental Shelf, shows the Elizabeth Islands, Vineyard Sound, and Martha’s Vineyard.
This image created using the Continuous Bathymetry and Elevation Models of the Massachusetts Coastal Zone and Continental Shelf, shows the Elizabeth Islands, Vineyard Sound, and Martha’s Vineyard.

Drone Pilots on a mission at Nelson Island Creek, Rowley, MA
In collaboration with the Marine Biological Laboratory (MBL) in Woods Hole, Massachusetts, the AIM group conducted UAS aerial surveys looking at vegetation classification/index surrounding a MBL gas flux tower located in Nelson Island Creek, Rowley, Massachusetts.
In collaboration with the Marine Biological Laboratory (MBL) in Woods Hole, Massachusetts, the AIM group conducted UAS aerial surveys looking at vegetation classification/index surrounding a MBL gas flux tower located in Nelson Island Creek, Rowley, Massachusetts.

USGS St. Petersburg Studebaker Building
This historic brick Studebaker Building, originally built in 1925, was chosen as the location for the USGS St. Petersburg Coastal and Marine Science Center in the late 1980s.
This historic brick Studebaker Building, originally built in 1925, was chosen as the location for the USGS St. Petersburg Coastal and Marine Science Center in the late 1980s.

Florida Coral Reefs and Coastal Hazard Risk Reduction
Rigorously Valuing the Role of Florida’s Coral Reefs in Coastal Hazard Risk Reduction
Estimated Annual Benefits
Rigorously Valuing the Role of Florida’s Coral Reefs in Coastal Hazard Risk Reduction
Estimated Annual Benefits

American Samoa Coral Reefs and Coastal Hazard Risk Reduction
Rigorously Valuing the Role of American Samoa’s Coral Reefs in Coastal Hazard Risk Reduction
Estimated Annual Benefits
Rigorously Valuing the Role of American Samoa’s Coral Reefs in Coastal Hazard Risk Reduction
Estimated Annual Benefits

Guam and CNMI Coral Reefs and Coastal Hazard Risk Reduction
Rigorously Valuing the Role of Guam’s Coral Reefs and the Commonwealth of the Northern Mariana Islands’s Coral Reefs in Coastal Hazard Risk Reduction
Estimated Annual Benefits
Rigorously Valuing the Role of Guam’s Coral Reefs and the Commonwealth of the Northern Mariana Islands’s Coral Reefs in Coastal Hazard Risk Reduction
Estimated Annual Benefits

Cliff Feature Delineation Tool Outputs in Malibu, California
Digital three-dimensional rendering of the coastal cliffs around Point Dume in Malibu, California. Cliff feature outputs from the Cliff Feature Delineation Tool are shown to conceptually display the cliff delineation process, including cross-shore transects (green), the cliff top line (red), the cliff toe line (blue), and subsidiary cliff features (orange).
Digital three-dimensional rendering of the coastal cliffs around Point Dume in Malibu, California. Cliff feature outputs from the Cliff Feature Delineation Tool are shown to conceptually display the cliff delineation process, including cross-shore transects (green), the cliff top line (red), the cliff toe line (blue), and subsidiary cliff features (orange).

Economic benefit of coral reef-lined coastlines in U.S.
Map displaying the distribution of total economic losses (direct building damages and indirect economic disruption) in the U.S. that are prevented from flooding by coral reefs annually. In total, the annual coastal flooding risk reduction benefits provided by U.S. coral reefs exceed $1.8 billion.
Map displaying the distribution of total economic losses (direct building damages and indirect economic disruption) in the U.S. that are prevented from flooding by coral reefs annually. In total, the annual coastal flooding risk reduction benefits provided by U.S. coral reefs exceed $1.8 billion.

Hawaiʻi Coral Reefs and Coastal Hazard Risk Reduction
Rigorously Valuing the Role of Hawaiʻi’s Coral Reefs in Coastal Hazard Risk Reduction
Estimated Annual Benefits
Rigorously Valuing the Role of Hawaiʻi’s Coral Reefs in Coastal Hazard Risk Reduction
Estimated Annual Benefits

U.S. Virgin Islands Coral Reefs and Coastal Hazard Risk Reduction
Rigorously Valuing the Role of the U.S. Virgin Islands’ Coral Reefs in Coastal Hazard Risk Reduction
Estimated Annual Benefits
Rigorously Valuing the Role of the U.S. Virgin Islands’ Coral Reefs in Coastal Hazard Risk Reduction
Estimated Annual Benefits

Puerto Rico Coral Reefs and Coastal Hazard Risk Reduction
Rigorously Valuing the Role of Puerto Rico’s Coral Reefs in Coastal Hazard Risk Reduction
Estimated Annual Benefits
Rigorously Valuing the Role of Puerto Rico’s Coral Reefs in Coastal Hazard Risk Reduction
Estimated Annual Benefits

The Coastal Change Hazards program engages with stakeholders
The Coastal Change Hazard (CCH) program’s Stakeholder Engagement and Communication (SEC) component is focused on connecting CCH science to stakeholders to learn more about their needs for data, tools, and information.
The Coastal Change Hazard (CCH) program’s Stakeholder Engagement and Communication (SEC) component is focused on connecting CCH science to stakeholders to learn more about their needs for data, tools, and information.