
The USGS Coastal Change Hazards team collects data to monitor coastal change – including how storms and waves shape and reshape our beaches. It’s important to keep track of how beaches change over time because they provide habitat for many creatures including birds and sea turtles, and they are beautiful locations where people love to live and vacation.
Images
Images intro.
Filter Total Items: 2135

Sea Turtle Nest on Madeira Beach
The USGS Coastal Change Hazards team collects data to monitor coastal change – including how storms and waves shape and reshape our beaches. It’s important to keep track of how beaches change over time because they provide habitat for many creatures including birds and sea turtles, and they are beautiful locations where people love to live and vacation.

Madeira Beach Camera Time Series
This photo is the results of processing a time series of images, which are a combination of all image frames collected during a 10 to 17-minute video. These images are incredibly useful for studying coastal change remotely, but the usefulness of the image depends on how they are processed.
This photo is the results of processing a time series of images, which are a combination of all image frames collected during a 10 to 17-minute video. These images are incredibly useful for studying coastal change remotely, but the usefulness of the image depends on how they are processed.

Aerial photos of barrier islands
We conduct fieldwork in a variety of barrier island settings to understand the relative importance of these factors, including Fire Island, NY; Rockaway, NY; Seven Mile Island, NJ; and Cedar Island, VA.
We conduct fieldwork in a variety of barrier island settings to understand the relative importance of these factors, including Fire Island, NY; Rockaway, NY; Seven Mile Island, NJ; and Cedar Island, VA.

Coastal Change Hazards Portal shows Hurricane Sally near Gulf Coast
As Hurricane Sally approached the US Gulf Coast, the USGS Coastal Change Hazards team produced a series of forecasts for impacts on the beach. Forecasts were updated daily based on wave and storm surge forecasts from NOAA.
As Hurricane Sally approached the US Gulf Coast, the USGS Coastal Change Hazards team produced a series of forecasts for impacts on the beach. Forecasts were updated daily based on wave and storm surge forecasts from NOAA.

Total Water Level and Coastal Change Forecast Expansion, 2020
The Total Water Level and Coastal Change Forecast has continually expanded since real-time forecasts began in 2015. In 2020, new regions of the Gulf and South Atlantic coasts were added to the forecast and officially approved for use in National Weather Service Forecasts.
The Total Water Level and Coastal Change Forecast has continually expanded since real-time forecasts began in 2015. In 2020, new regions of the Gulf and South Atlantic coasts were added to the forecast and officially approved for use in National Weather Service Forecasts.

Coastal Change Hazards Portal for Hurricane Laura
This Coastal Change Storm Hazard Team forecast was made at 4 AM CDT August 26, 2020 and shows forecast beach erosion at the base of the dunes (the strip of colored bars closest to the coast), overwash (middle strip) and inundation (outer strip) from Hurricane Laura. The model accounts for sandy beaches and barrier islands and does not include marshes,
This Coastal Change Storm Hazard Team forecast was made at 4 AM CDT August 26, 2020 and shows forecast beach erosion at the base of the dunes (the strip of colored bars closest to the coast), overwash (middle strip) and inundation (outer strip) from Hurricane Laura. The model accounts for sandy beaches and barrier islands and does not include marshes,

Offshore northern California bathymetric map
Bathymetric map of offshore northern California reveals seafloor features and submarine canyons.
Bathymetric map of offshore northern California reveals seafloor features and submarine canyons.

Bathymetric map of offshore Oregon
Bathymetric map of offshore Oregon with Stonewall, Heceta, and Siltcoos Banks labeled.
Bathymetric map of offshore Oregon with Stonewall, Heceta, and Siltcoos Banks labeled.

Bathymetric map of offshore Washington
Bathymetric map of offshore Washington reveals seafloor features and submarine canyons.
Bathymetric map of offshore Washington reveals seafloor features and submarine canyons.

Cascadia megathrust fault map
Topo-bathymetric map of the Cascadia subduction zone. Cascadia megathrust fault (white line); approximate shelf break along 200-m isobath (yellow line); MTJ, Mendocino triple junction.
Topo-bathymetric map of the Cascadia subduction zone. Cascadia megathrust fault (white line); approximate shelf break along 200-m isobath (yellow line); MTJ, Mendocino triple junction.

Subduction zone schematic
Schematic cross-section of the accretionary wedge along the Cascadia subduction zone. Modified from Moore and others, 2007.
Schematic cross-section of the accretionary wedge along the Cascadia subduction zone. Modified from Moore and others, 2007.

Cascadia fieldwork map
Index map of U.S. Cascadia margin showing where data have been collected since 2018 as part of the Subduction Zone Marine Geohazards Project. Details of each survey effort are provided on the Cascadia Subduction Zone Marine Geohazards project web site.
Index map of U.S. Cascadia margin showing where data have been collected since 2018 as part of the Subduction Zone Marine Geohazards Project. Details of each survey effort are provided on the Cascadia Subduction Zone Marine Geohazards project web site.

Aerial image from post-Hurricane Isaias of North Carolina coast
The USGS Remote Sensing Coastal Change Project collected aerial imagery of the northern Outer Banks, North Carolina coastline from pre- and post-Hurricane Isaias, in order to use Structure-from-Motion techniques to produce digital elevation models (DEMs) and orthomosaic photos, to be used in evaluating the storm-induced coastal change, such as sand transported onto
The USGS Remote Sensing Coastal Change Project collected aerial imagery of the northern Outer Banks, North Carolina coastline from pre- and post-Hurricane Isaias, in order to use Structure-from-Motion techniques to produce digital elevation models (DEMs) and orthomosaic photos, to be used in evaluating the storm-induced coastal change, such as sand transported onto
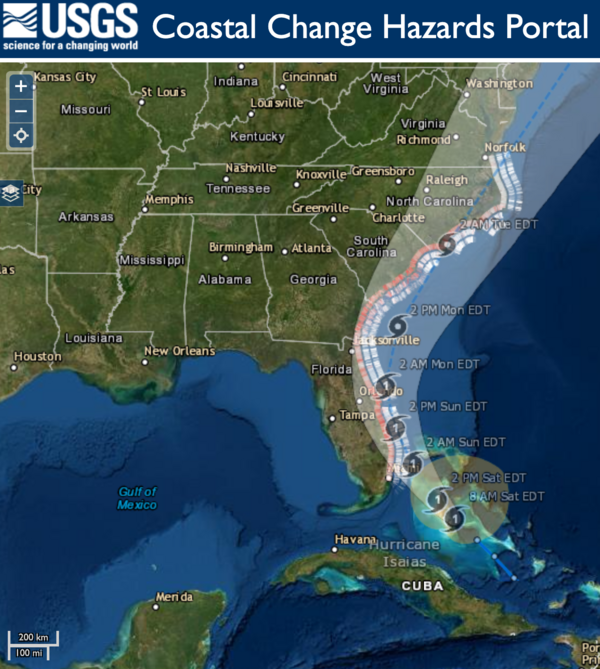
Hurricane Isaias Unlikely to Cause Widespread Atlantic Beach Erosion
USGS coastal change experts predict that storm waves kicked up by the Category 1 hurricane are likely to cause some erosion at the base of the dunes along about 11 percent of coastal beaches between Florida and Virginia.
USGS coastal change experts predict that storm waves kicked up by the Category 1 hurricane are likely to cause some erosion at the base of the dunes along about 11 percent of coastal beaches between Florida and Virginia.

Elwha River delta
View looks southwest along the eastern flank of the Elwha River delta and back towards the mouth of the river. USGS conducts regular surveys along this stretch of coastline, to monitor the evolving coastline following removal of the Elwha and Glines Canyon Dams, completed in 2014.
View looks southwest along the eastern flank of the Elwha River delta and back towards the mouth of the river. USGS conducts regular surveys along this stretch of coastline, to monitor the evolving coastline following removal of the Elwha and Glines Canyon Dams, completed in 2014.

Taking PPE to a whole new level
You have to be able to have a little fun when in the field. A colleague from the Washington State Department of Ecology hams it up while prepping for a beach survey with scientists from the USGS Pacific Coastal and Marine Science Center.
You have to be able to have a little fun when in the field. A colleague from the Washington State Department of Ecology hams it up while prepping for a beach survey with scientists from the USGS Pacific Coastal and Marine Science Center.

Fort Stevens State Park
Photo of surf zone offshore of Fort Stevens State Park taken from the Columbia River South Jetty observation deck.
Photo of surf zone offshore of Fort Stevens State Park taken from the Columbia River South Jetty observation deck.

Seamline Appearance Before and After Applying a DEM Fusion Algorithm
A map series showing a subset of the Puerto Rico bathymetric study area. Panels compare a “simple mosaic” formed by overlaying the most recent dataset on top of the older dataset (left panel) with the same dataset processed with the DEM fusion method (right panel).
A map series showing a subset of the Puerto Rico bathymetric study area. Panels compare a “simple mosaic” formed by overlaying the most recent dataset on top of the older dataset (left panel) with the same dataset processed with the DEM fusion method (right panel).

Vegetated dunes on Cocoa Beach, Florida
A view looking north on Cocoa beach towards Kennedy Space Station. Coastal infrastructure and natural resources such as sediment and beach vegetation can all be affected by coastal change processes.
A view looking north on Cocoa beach towards Kennedy Space Station. Coastal infrastructure and natural resources such as sediment and beach vegetation can all be affected by coastal change processes.

A large washover fan on Fire Island, New York in 2012 after Hurricane
Strong storms such as hurricanes can cause drastic changes to coastal environments. For example, this large washover fan was created on Fire Island, New York in 2012 after Hurricane Sandy by waves moving sediment from the dunes and beach towards the back-barrier environment.
Strong storms such as hurricanes can cause drastic changes to coastal environments. For example, this large washover fan was created on Fire Island, New York in 2012 after Hurricane Sandy by waves moving sediment from the dunes and beach towards the back-barrier environment.