
Biplot of principal component analysis of soil elemental composition data. Background and enriched samples are denoted. Colored points are from potentially enriched soils at mine sites, and black points are from unmined background sites. The effect of different elements on the analysis is shown by the rays, which are labeled to identify the elements.
Images
Images intro.
Filter Total Items: 411

Biplot of principal component analysis
Biplot of principal component analysis of soil elemental composition data. Background and enriched samples are denoted. Colored points are from potentially enriched soils at mine sites, and black points are from unmined background sites. The effect of different elements on the analysis is shown by the rays, which are labeled to identify the elements.

Cyanobacterial bloom at Ash River Harbor near Voyageurs National Park
A cyanobacterial bloom in late fall at Ash River Harbor in Kabetogama Lake, Voyageurs National Park
A cyanobacterial bloom in late fall at Ash River Harbor in Kabetogama Lake, Voyageurs National Park

Cyanobacterial bloom at Ash River Harbor near Voyageurs National Park
Cyanobacterial bloom at Kabetogama Lake in Voyageurs National Park
Cyanobacterial bloom at Kabetogama Lake in Voyageurs National Park

Cyanobacterial bloom at Ash River Harbor near Voyageurs National Park
Cyanobacterial bloom in Kabetogama Lake with fall leaves in the background
Cyanobacterial bloom in Kabetogama Lake with fall leaves in the background

Panoramic view of scientists in boat on Hells Canyon Reservoir
Panoramic view of scientists in boat on Hells Canyon Reservoir, Idaho
Panoramic view of scientists in boat on Hells Canyon Reservoir, Idaho

An algal bloom near the Ash River Visitor Center at Kabetogama Lake
An algal bloom near the Ash River Visitor Center at Kabetogama Lake, where visitors enjoy picnics and trails year-round.
An algal bloom near the Ash River Visitor Center at Kabetogama Lake, where visitors enjoy picnics and trails year-round.

Algal bloom near the Ash River boat dock
Algal bloom near the Ash River boat dock, a public access point for boating and fishing on Kabetogama Lake. Microcystin has been detected at this location and at nearby Sullivan Bay at concentrations exceeding recreational guidelines.
Algal bloom near the Ash River boat dock, a public access point for boating and fishing on Kabetogama Lake. Microcystin has been detected at this location and at nearby Sullivan Bay at concentrations exceeding recreational guidelines.

Particulate matter captured on a quartz fiber filter
Particulate matter captured on a quartz fiber filter at the Mercury Research Laboratory.
Particulate matter captured on a quartz fiber filter at the Mercury Research Laboratory.

Eosin-nigrosin staining of spermatozoa from common carp
Eosin-nigrosin staining of spermatozoa from common carp (Cyprinus carpio) testes collected from the Lake Mead National Recreation Area, Nevada
Eosin-nigrosin staining of spermatozoa from common carp (Cyprinus carpio) testes collected from the Lake Mead National Recreation Area, Nevada

Microscopic video imaging for computerized analysis of sperm motility
Microscopic video imaging is used for computerized analysis of sperm motility parameters
Microscopic video imaging is used for computerized analysis of sperm motility parameters

Tablet-enabled field forms have been developed to help field efforts
Tablet-enabled field forms have been developed to help coordinate field efforts, collect site information, GPS coordinates, photos, and control data collection.
Tablet-enabled field forms have been developed to help coordinate field efforts, collect site information, GPS coordinates, photos, and control data collection.

A USGS scientist prepares a sample to test the effect of antibiotics
A USGS scientist prepares a sample to test the effect of antibiotics on denitrifying bacteria within a glove box. A glove box allows scientists to work with samples in an anaerobic (no oxygen) atmosphere, the conditions under which denitrification occurs.
A USGS scientist prepares a sample to test the effect of antibiotics on denitrifying bacteria within a glove box. A glove box allows scientists to work with samples in an anaerobic (no oxygen) atmosphere, the conditions under which denitrification occurs.
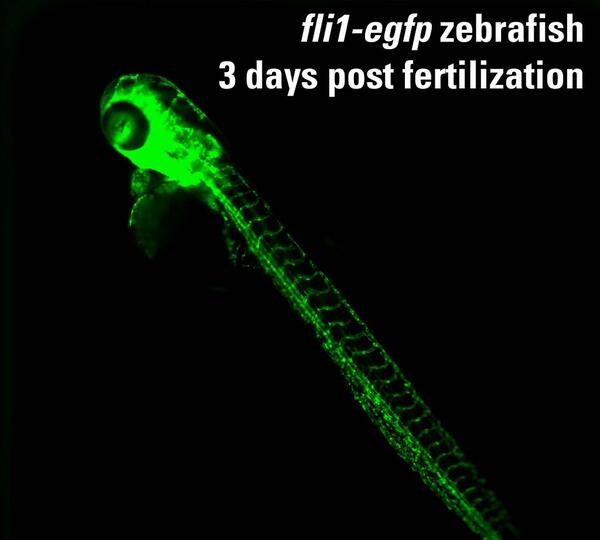
Using the 384-well plate format, a single zebrafish embryo is tested
Using the 384-well plate format, a single zebrafish embryo is tested in each well. This is an example of a 72 hour post fertilization fli1:egfp zebrafish (3 millimeters long) imaged under a fluorescein isothiocyanate (FITC) filter.
Using the 384-well plate format, a single zebrafish embryo is tested in each well. This is an example of a 72 hour post fertilization fli1:egfp zebrafish (3 millimeters long) imaged under a fluorescein isothiocyanate (FITC) filter.
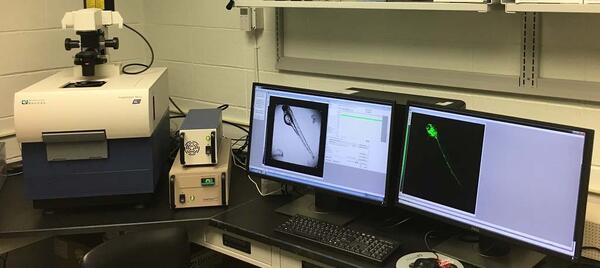
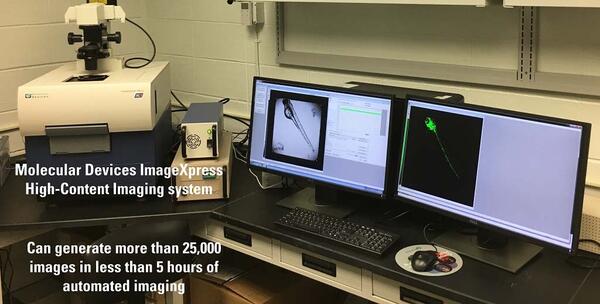
Molecular Devices ImageXpress† High-Content Imaging System
Molecular Devices ImageXpress† High-Content Imaging System
Molecular Devices ImageXpress† High-Content Imaging System
Molecular Devices ImageXpress† High-Content Imaging System
Molecular Devices ImageXpress† High-Content Imaging System that can generate more than 25,000 images in less than 5 hours of automated image acquisition.
Molecular Devices ImageXpress† High-Content Imaging System that can generate more than 25,000 images in less than 5 hours of automated image acquisition.

(USGS scientist working on data analysis of cyanotoxins in water
U.S. Geological Survey (USGS) scientist working on data analysis of cyanotoxins in water samples
U.S. Geological Survey (USGS) scientist working on data analysis of cyanotoxins in water samples

Keith A. Loftin is the lead scientist for algal and cyanobacteria
Keith A. Loftin, USGS, is the lead scientist for algal and cyanobacterial toxins
Keith A. Loftin, USGS, is the lead scientist for algal and cyanobacterial toxins

USGS scientists evaluating the nebulizer assembly
USGS scientists evaluating the nebulizer assembly in a mixed mode ionization source of a triple quadrupole mass spectrometer used to measure individual cyanotoxins
USGS scientists evaluating the nebulizer assembly in a mixed mode ionization source of a triple quadrupole mass spectrometer used to measure individual cyanotoxins

Native birds resting on marker buoys in Brownlee Reservoir, Idaho
Native birds resting on marker buoys in Brownlee Reservoir, Idaho.
Native birds resting on marker buoys in Brownlee Reservoir, Idaho.

Draining overlying water from sedimentation sampler
Draining overlying water from sedimentation sampler at Brownlee Reservoir, Idaho.
Draining overlying water from sedimentation sampler at Brownlee Reservoir, Idaho.

Photograph of the entrance to Grand Traverse Bay Harbor
Photograph of the entrance to Grand Traverse Bay Harbor, located 8 kilometers downdrift of the spoils pile. Migration of the dark-colored stamp sands (moving from left to right) has buried the original beach, overtopped the wall, and partially blocked the channel.
Photograph of the entrance to Grand Traverse Bay Harbor, located 8 kilometers downdrift of the spoils pile. Migration of the dark-colored stamp sands (moving from left to right) has buried the original beach, overtopped the wall, and partially blocked the channel.