Map of the Martha’s Vineyard and Nantucket study sites outlined in red.
Images
Images

Map of the Martha’s Vineyard and Nantucket study sites outlined in red.

The distribution of sediment textures within the study area. The bottom-type classification is from Barnhardt and others (1998) and is based on 16 sediment classes. The classification is based on four sediment units that include gravel (G), mud (M), rock (R), and sand (S). If the texture is greater than 90 percent, it is labeled with a single letter.
The distribution of sediment textures within the study area. The bottom-type classification is from Barnhardt and others (1998) and is based on 16 sediment classes. The classification is based on four sediment units that include gravel (G), mud (M), rock (R), and sand (S). If the texture is greater than 90 percent, it is labeled with a single letter.

Geologic sections (C-C', D-D', and E-E') illustrating the general distributions and thicknesses of seismic stratigraphic units and major unconformities in the Martha’s Vineyard and Nantucket study areas.
Geologic sections (C-C', D-D', and E-E') illustrating the general distributions and thicknesses of seismic stratigraphic units and major unconformities in the Martha’s Vineyard and Nantucket study areas.
Image showing a collage of examples of multi-channel and single-channel seismic data collected by the USGS, seismic equipment deployed from a research vessel, and seismic equipment on a research vessel. These data are critical to the CMG Program as they define the geology in marine and coastal environments.
Image showing a collage of examples of multi-channel and single-channel seismic data collected by the USGS, seismic equipment deployed from a research vessel, and seismic equipment on a research vessel. These data are critical to the CMG Program as they define the geology in marine and coastal environments.
SEABed Observation and Sampling System (SEABOSS) (center image) and the MiniSEABOSS (right) designed for rapid, inexpensive, and effective collection of seabed imagery (photographs and video) as well sediment samples from the coastal/inner-continental shelf regions.
SEABed Observation and Sampling System (SEABOSS) (center image) and the MiniSEABOSS (right) designed for rapid, inexpensive, and effective collection of seabed imagery (photographs and video) as well sediment samples from the coastal/inner-continental shelf regions.
3D Image of a multi-channel seismic (MCS) line showing gas (blue/green) migrating up through fractures in the subsurface, culminating in a 600 meter tall plume of methane gas in the water column that was captured using a Simrad EK60 split beam echo sounder.
3D Image of a multi-channel seismic (MCS) line showing gas (blue/green) migrating up through fractures in the subsurface, culminating in a 600 meter tall plume of methane gas in the water column that was captured using a Simrad EK60 split beam echo sounder.

Cuyahoga River at Independence OH - view from edge of river
Cuyahoga River at Independence OH - view from edge of river
Yellow Creek near Oak Grove, IN - gage on bridge
Yellow Creek near Oak Grove, IN - gage on bridge
RV Petrel towing subbottom profiler (yellow raft) parallel to the beach to measure the thickness of sand offshore.
RV Petrel towing subbottom profiler (yellow raft) parallel to the beach to measure the thickness of sand offshore.

Coastal wetland ecosystems in Jamaica Bay, New York, provide important ecosystem services along the highly urbanized Atlantic coast.
Coastal wetland ecosystems in Jamaica Bay, New York, provide important ecosystem services along the highly urbanized Atlantic coast.

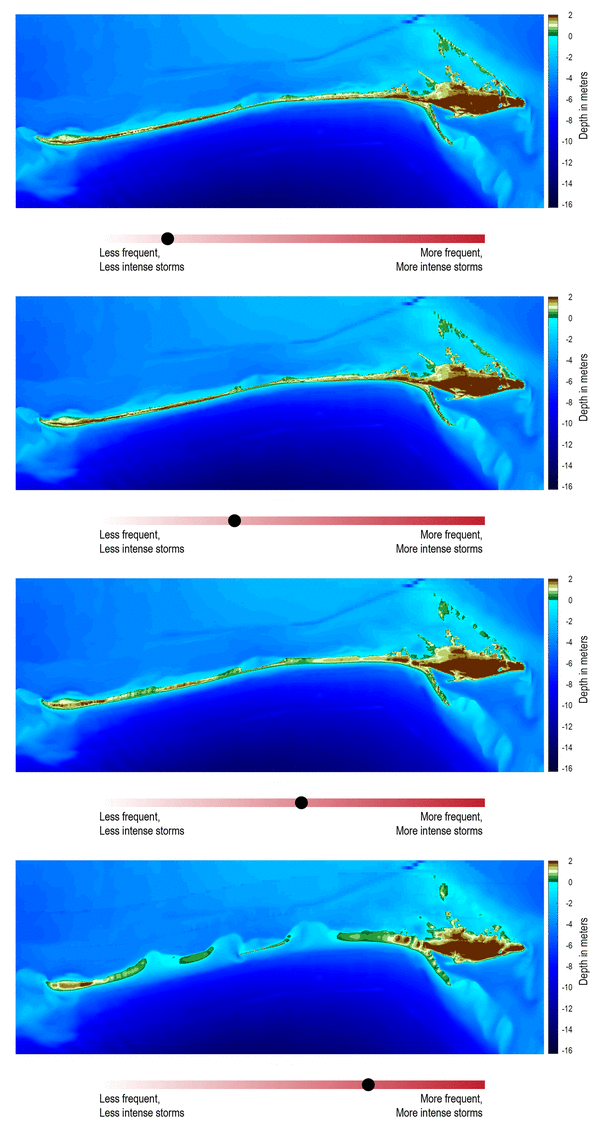
This model shows what Dauphin Island, Alabama, may look like under moderate storms but with increasing rates of sea level rise (Passeri and others, 2018).
This model shows what Dauphin Island, Alabama, may look like under moderate storms but with increasing rates of sea level rise (Passeri and others, 2018).

Storm and sea level rise scenario models, like the one shown here, can be used to explore the future. This model shows what Dauphin Island may look like 10 years from now if storms become stronger and more frequent (Passeri and others, 2018).
Storm and sea level rise scenario models, like the one shown here, can be used to explore the future. This model shows what Dauphin Island may look like 10 years from now if storms become stronger and more frequent (Passeri and others, 2018).
USGS unmanned aerial system (uas) mapping team on the beach in Dauphin Island, Alabama
USGS unmanned aerial system (uas) mapping team on the beach in Dauphin Island, Alabama
Yellow River at Knox, IN - upstream of bridge
Yellow River at Knox, IN - upstream of bridge
Tulum, Mexico jungle panorama
USGS personnel preparing to dive in Yucatan Peninsula.
USGS personnel preparing to dive in Yucatan Peninsula.
Hike through the jungle in Tulum, Mexico
Hike through the jungle in Tulum, Mexico

Collecting water samples in Yucatan Peninsula, Mexico.
Collecting water samples in Yucatan Peninsula, Mexico.

Eagle Creek at Zionsville, IN - downstream of gage
Eagle Creek at Zionsville, IN - downstream of gage

Northeast Region Photo Contest Winner | February 2019 | USGS at Work
Banu Bayraktar making a streamflow measurement at Carmans River, Yaphank, NY
Northeast Region Photo Contest Winner | February 2019 | USGS at Work
Banu Bayraktar making a streamflow measurement at Carmans River, Yaphank, NY


