
The R/V Muddy Waters lends itself to be a versatile survey launch and assistance vessel for the deployment and retrieval of inshore moorings and scientific sensor platforms. The boat can easily be towed to location by a full sized pickup truck and is easily launched and retrieved for fast mobilization after storm events or other rapid response surveys.
Images
Images intro.
Filter Total Items: 7147

R/V Muddy Waters
The R/V Muddy Waters lends itself to be a versatile survey launch and assistance vessel for the deployment and retrieval of inshore moorings and scientific sensor platforms. The boat can easily be towed to location by a full sized pickup truck and is easily launched and retrieved for fast mobilization after storm events or other rapid response surveys.

Photograph of Bayou Heron, Mississippi
Photograph of moving-boat ADCP discharge measurements being made in Bayou Heron, Mississippi
Photograph of moving-boat ADCP discharge measurements being made in Bayou Heron, Mississippi

Seafloor mapping systems
Graphic showing geophysical and sampling systems used to define the seafloor topography, surface sediments, and underlying geology.
Graphic showing geophysical and sampling systems used to define the seafloor topography, surface sediments, and underlying geology.

Map showing the location of the Delmarva Peninsula
Map showing the location of the Delmarva Peninsula with a hillslope shaded relief map of the study area.
Map showing the location of the Delmarva Peninsula with a hillslope shaded relief map of the study area.

Backscatter, bathymetry, and hill shaded relief maps
(A) Maximum Likelihood Classification (MLC) with two inputs, slope, and ISO-classified backscatter for the whole survey area. (B) MLC with five inputs, slope, ISO-classified backscatter, bathymetry, hillshaded-relief, and curvature.
(A) Maximum Likelihood Classification (MLC) with two inputs, slope, and ISO-classified backscatter for the whole survey area. (B) MLC with five inputs, slope, ISO-classified backscatter, bathymetry, hillshaded-relief, and curvature.

CoSMoS map of San Francisco
Example of CoSMoS projection displayed in the Our Coast, Our Future (OCOF) online tool.
Example of CoSMoS projection displayed in the Our Coast, Our Future (OCOF) online tool.

CoSMoS projection for San Diego
Example of CoSMoS projected flooding extents for a 1.5 meter sea level rise in combination with possible 100 year return period coastal storms.
Example of CoSMoS projected flooding extents for a 1.5 meter sea level rise in combination with possible 100 year return period coastal storms.

Samples Repository Collections map interface
Map interface of Cores, grabs, dredges, slides, and other samples, primarily of marine, estuarine, and lacustrine sediments, curated at the USGS Woods Hole Coastal and Marine Science Center.
Map interface of Cores, grabs, dredges, slides, and other samples, primarily of marine, estuarine, and lacustrine sediments, curated at the USGS Woods Hole Coastal and Marine Science Center.

Hydrotherm program output example
Example Hydrotherm output. Hydrotherm is a three-dimensional simulation of multiphase groundwater flow and heat transport in the temperature range of 0 to 1200 degrees Celsius and the pressure range of 1 to 1000 MPa.
Example Hydrotherm output. Hydrotherm is a three-dimensional simulation of multiphase groundwater flow and heat transport in the temperature range of 0 to 1200 degrees Celsius and the pressure range of 1 to 1000 MPa.

PCMSC Marine Minerals Laboratory
A look into the USGS Pacific Coastal and Marine Science Center’s Marine Minerals Laboratory Suite.
A look into the USGS Pacific Coastal and Marine Science Center’s Marine Minerals Laboratory Suite.

PCMSC Marine Minerals Laboratory
A look into the USGS Pacific Coastal and Marine Science Center’s Marine Minerals Laboratory Suite.
A look into the USGS Pacific Coastal and Marine Science Center’s Marine Minerals Laboratory Suite.

PCMSC Marine Minerals Laboratory
A look into the USGS Pacific Coastal and Marine Science Center’s Marine Minerals Laboratory Suite.
A look into the USGS Pacific Coastal and Marine Science Center’s Marine Minerals Laboratory Suite.

PCMSC Marine Minerals Laboratory
A look into the USGS Pacific Coastal and Marine Science Center’s Marine Minerals Laboratory Suite.
A look into the USGS Pacific Coastal and Marine Science Center’s Marine Minerals Laboratory Suite.

Scientific Research in Great South Bay, NY
Steve Suttles and Neil Ganju surveying the position of a deployed oceanographic platform in Great South Bay, NY
Steve Suttles and Neil Ganju surveying the position of a deployed oceanographic platform in Great South Bay, NY

Map of Marsh shoreline change rates
Map of Edwin B Forsythe National Wildlife Refuge, N.J., marsh shoreline change rates.
Map of Edwin B Forsythe National Wildlife Refuge, N.J., marsh shoreline change rates.

Barnegat Bay Little Egg Harbor Study Site
Barnegat Bay Little Egg Harbor Study Site

Basemap image of the survey locations, south of Long Island, NY
Basemap image of the survey locations south of Long Island Sound
Basemap image of the survey locations south of Long Island Sound

Bathymetry and Elevation Models of the Massachusetts Coastal Zone
Overview of the 4 Continuous Bathymetry and Elevation Models of the Massachusetts Coastal Zone and Continental Shelf
Overview of the 4 Continuous Bathymetry and Elevation Models of the Massachusetts Coastal Zone and Continental Shelf
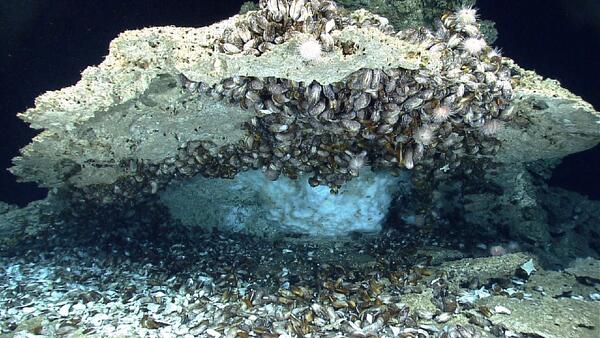
Ice-like gas hydrates under capping rock encrusted with mussels
Ice-like gas hydrates under capping rock encrusted with mussels on the sea floor of the northern Gulf of Mexico.
Ice-like gas hydrates under capping rock encrusted with mussels on the sea floor of the northern Gulf of Mexico.

Piping Plovers
An interdisciplinary USGS team is conducting research and developing tools to identify suitable coastal habitats for species of concern, such as the piping plover (Charadrius melodus), under a variety of sea-level rise scenarios.
An interdisciplinary USGS team is conducting research and developing tools to identify suitable coastal habitats for species of concern, such as the piping plover (Charadrius melodus), under a variety of sea-level rise scenarios.

Browse collage for 2017-003-FA data release
Browse collage for 2017-003-FA data release
Browse collage for 2017-003-FA data release