
Graphs showing trends in atmospheric precipitation and air temperature in the Lower Colorado River Basin, 1896-2019
Images
Explore water-related photography, imagery, and illustrations.
Filter Total Items: 2415

Lower Colorado Basin Precipitation Temperature 1896-2019_graph.jpg
Graphs showing trends in atmospheric precipitation and air temperature in the Lower Colorado River Basin, 1896-2019

Graph showing trends in annual total precipitation and annual average air temperature in the Lower Colorado River Basin
linkGraphs showing trends in the sum of annual atmospheric precipitation and annual average air temperature in the Lower Colorado River Basin, 1896-2019
Graph showing trends in annual total precipitation and annual average air temperature in the Lower Colorado River Basin
linkGraphs showing trends in the sum of annual atmospheric precipitation and annual average air temperature in the Lower Colorado River Basin, 1896-2019

Graph showing 1951-2020 and 2020-2099 precipitation and temperatures.jpg
Boxplots showing precipitation and temperature ranges from 1951-2019 and 2020-2099 in the Colorado River Basin, by Tillman and others (2020), USGS SIR 2020-5107
Boxplots showing precipitation and temperature ranges from 1951-2019 and 2020-2099 in the Colorado River Basin, by Tillman and others (2020), USGS SIR 2020-5107

Graph showing 1896-2019 precipitation and temperatures in the CRB.jpg
Graphs showing trends in precipitation and temperature in the Colorado River Basin, 1896-2019, published in Tillman and others (2020), USGS SIR 2020-5107
Graphs showing trends in precipitation and temperature in the Colorado River Basin, 1896-2019, published in Tillman and others (2020), USGS SIR 2020-5107

Diagram of water flow through a copper ore flotation plant and unlined tailings storage facility
linkSchematic diagram of water flow through a conventional copper-ore flotation plant and unlined tailings storage facility illustrating water losses (in italics), reclamation of process water, and addition of makeup water.

New USGS Hydrologic Instrumentation Facility in Tuscaloosa, Alabama
The new Hydrologic Instrumentation Facility (HIF) on the University of Alabama Campus at Tuscaloosa, AL. The new facility is a national USGS capability that includes:
The new Hydrologic Instrumentation Facility (HIF) on the University of Alabama Campus at Tuscaloosa, AL. The new facility is a national USGS capability that includes:

Tilting flume in the USGS Hydrologic Instrumentation Facility's new hydraulics laboratory
View of tilting flume from the catwalk above the hydraulics laboratory at the USGS Hydrologic Instrumentation Facility.
View of tilting flume from the catwalk above the hydraulics laboratory at the USGS Hydrologic Instrumentation Facility.

Wet chemistry lab at the USGS Hydrologic Instrumentation Facility
Wet chemistry lab under construction at the USGS Hydrologic Instrumentation Facility.
Wet chemistry lab under construction at the USGS Hydrologic Instrumentation Facility.

Walk-in temperature chamber at the USGS Hydrologic Instrumentation Facility
Person standing inside the walk-in temperature chamber at the Hydrologic Instrumentation Facility.
Person standing inside the walk-in temperature chamber at the Hydrologic Instrumentation Facility.

Hydraulics lab at the USGS Hydrologic Instrumentation Facility
The hydraulics lab at the USGS Hydrologic Instrumentation Facility, complete with tow tank, tilting flume, and wave-generating test basin, near completion in June 2024.
The hydraulics lab at the USGS Hydrologic Instrumentation Facility, complete with tow tank, tilting flume, and wave-generating test basin, near completion in June 2024.

USGS Scientists Deploy to New Mexico Fire to Enhance Water Monitoring
USGS Water and Fire Technicians team members, Jorge Gonzalez and Efren Alvarado, made repairs to the Buck Mountain precipitation gage during the Blue 2 Fire near Alto, New Mexico on June 7, 2024. This station, along with similar gages, provides critical real-time rainfall data to the National Weather Service and local emergency managers.
USGS Water and Fire Technicians team members, Jorge Gonzalez and Efren Alvarado, made repairs to the Buck Mountain precipitation gage during the Blue 2 Fire near Alto, New Mexico on June 7, 2024. This station, along with similar gages, provides critical real-time rainfall data to the National Weather Service and local emergency managers.
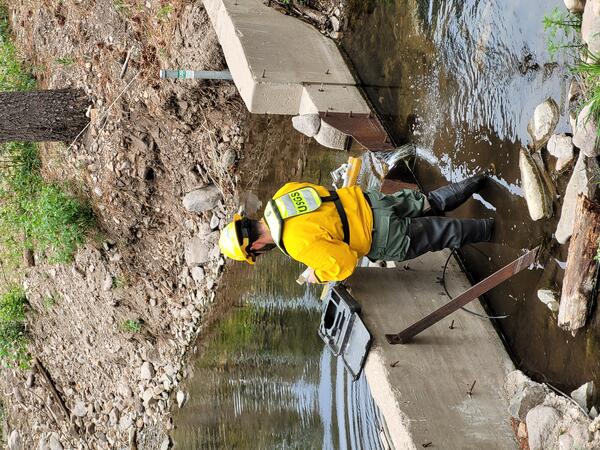
Repairing a streamgage during the Blue 2 Fire near Alto, New Mexico
A member of the USGS Water and Fire Technicians Team repairs a streamgage during the Blue 2 Fire near Alto, New Mexico.
A member of the USGS Water and Fire Technicians Team repairs a streamgage during the Blue 2 Fire near Alto, New Mexico.

The USGS Water and Fire Technicians Team prepares to evaluate precipitation and streamflow gauges during the Blue 2 Fire near Alto, New Mexico.
linkThe USGS Water and Fire Technicians Team prepares to evaluate precipitation and streamflow gauges during the Blue 2 Fire near Alto, New Mexico.
The USGS Water and Fire Technicians Team prepares to evaluate precipitation and streamflow gauges during the Blue 2 Fire near Alto, New Mexico.
linkThe USGS Water and Fire Technicians Team prepares to evaluate precipitation and streamflow gauges during the Blue 2 Fire near Alto, New Mexico.

Sampling the Mississippi River above Vicksburg at Mile 438
USGS scientists out on the Mississippi River above Vicksburg use a D-99 sampler to collect sediment and water-quality samples from the large inland river.
USGS scientists out on the Mississippi River above Vicksburg use a D-99 sampler to collect sediment and water-quality samples from the large inland river.

4_15_IGpost_NYCbedrock_Drupal.png
Image shows a screenshot of the New York City Bedrock and Groundwater Mapper.
Image shows a screenshot of the New York City Bedrock and Groundwater Mapper.

Water Use Diagram
Diagram of the process of water use from source (surface water, groundwater, reuse water) through transmission, utility reservoir, water treatment, distribution, and withdrawal for industry, residential, and commercial.
Diagram of the process of water use from source (surface water, groundwater, reuse water) through transmission, utility reservoir, water treatment, distribution, and withdrawal for industry, residential, and commercial.

Gage Greatness 2024 Bracket Finale Tie
The final bracket for Gage Greatness 2024 announcing the winners:
The final bracket for Gage Greatness 2024 announcing the winners:

Gage Greatness 2024 Finals bracket image
The bracket for the Finals! New Jersey's and Colorado's gages will compete to see whose gage is the greatest for Gage Greatest 2024.
The bracket for the Finals! New Jersey's and Colorado's gages will compete to see whose gage is the greatest for Gage Greatest 2024.

Hypothetical Riverine Floodplain Diagram (with caption)
A cross-sectional view of a hypothetical river showing one possible arrangement of the three Federal Flood Risk Management Standard (FFRMS) floodplain elevations (Climate-Informed Science Approach, the Freeboard Value Approach, and the 0.2% Annual-Chance Flood Approach) above the current Base Flood Elevation, i.e., the 1% annual-chance flood elevation.
A cross-sectional view of a hypothetical river showing one possible arrangement of the three Federal Flood Risk Management Standard (FFRMS) floodplain elevations (Climate-Informed Science Approach, the Freeboard Value Approach, and the 0.2% Annual-Chance Flood Approach) above the current Base Flood Elevation, i.e., the 1% annual-chance flood elevation.

Hypothetical Riverine Floodplain Diagram
A cross-sectional view of a hypothetical river showing one possible arrangement of the three Federal Flood Risk Management Standard (FFRMS) floodplain elevations (Climate-Informed Science Approach, the Freeboard Value Approach, and the 0.2% Annual-Chance Flood Approach) above the current Base Flood Elevation, i.e., the 1% annual-chance flood elevation.
A cross-sectional view of a hypothetical river showing one possible arrangement of the three Federal Flood Risk Management Standard (FFRMS) floodplain elevations (Climate-Informed Science Approach, the Freeboard Value Approach, and the 0.2% Annual-Chance Flood Approach) above the current Base Flood Elevation, i.e., the 1% annual-chance flood elevation.

Hypothetical Coastal Floodplain Diagram
A cross-sectional view of a hypothetical coastline showing one possible arrangement of the three Federal Flood Risk Management Standard (FFRMS) floodplain elevations (Climate-Informed Science Approach, the Freeboard Value Approach, and the 0.2% Annual-Chance Flood Approach) above the current Base Flood Elevation, i.e., the 1% annual-chance flood elevation.
A cross-sectional view of a hypothetical coastline showing one possible arrangement of the three Federal Flood Risk Management Standard (FFRMS) floodplain elevations (Climate-Informed Science Approach, the Freeboard Value Approach, and the 0.2% Annual-Chance Flood Approach) above the current Base Flood Elevation, i.e., the 1% annual-chance flood elevation.