
Water is one of America's greatest assets, providing energy, irrigation for crops, and water for homes and businesses. But water isn't always safe or reliable, and damages are costly. To protect lives and keep our country prosperous, we need information on the state of our water resources. USGS collects and delivers the water data our nation needs.
Images
Explore water-related photography, imagery, and illustrations.
Filter Total Items: 2475

Water Data Keep Us Strong
Water is one of America's greatest assets, providing energy, irrigation for crops, and water for homes and businesses. But water isn't always safe or reliable, and damages are costly. To protect lives and keep our country prosperous, we need information on the state of our water resources. USGS collects and delivers the water data our nation needs.

U.S. River Conditions, January to March 2025
U.S. River Conditions, January to March 2025 thumbnail image. The river conditions shown range from the driest condition seen at a gage (red open circles) to the wettest (blue closed circles). A purple outer ring around a gage indicates it is flooding.
U.S. River Conditions, January to March 2025 thumbnail image. The river conditions shown range from the driest condition seen at a gage (red open circles) to the wettest (blue closed circles). A purple outer ring around a gage indicates it is flooding.

Integrated Water Science Basins
Selected reference basins (darker shaded basins)—referred to as Integrated Water Science (IWS) basins—are intensively monitored study basins representing a wide range of environmental, hydrologic, and landscape settings and human stressors of water resources to improve our understanding of water availability across the Nation.
Selected reference basins (darker shaded basins)—referred to as Integrated Water Science (IWS) basins—are intensively monitored study basins representing a wide range of environmental, hydrologic, and landscape settings and human stressors of water resources to improve our understanding of water availability across the Nation.
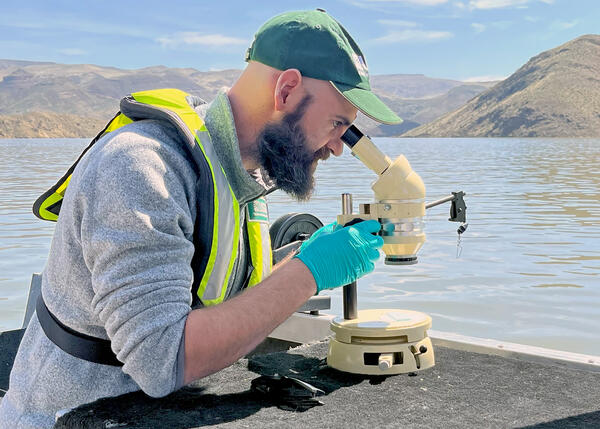
Water-quality reconnaissance of Owyhee Reservoir, eastern Oregon
Research hydrologist Tyler King of the U.S. Geological Survey's Hydrologic Remote Sensing Branch examines a water sample collected from Owyhee Reservoir in eastern Oregon, April 10, 2025. King and scientists from the U.S.
Research hydrologist Tyler King of the U.S. Geological Survey's Hydrologic Remote Sensing Branch examines a water sample collected from Owyhee Reservoir in eastern Oregon, April 10, 2025. King and scientists from the U.S.

Long-term groundwater hydrograph from a Climate Response Network site in Oneida County, New York
linkGroundwater hydrograph showing field measurements of depth to water level from a Climate Response Network monitoring well (USGS site 433112075091501) located in Oneida County, New York.
Long-term groundwater hydrograph from a Climate Response Network site in Oneida County, New York
linkGroundwater hydrograph showing field measurements of depth to water level from a Climate Response Network monitoring well (USGS site 433112075091501) located in Oneida County, New York.

USGS water expert performs maintenance on a streamgage upstream of a water-treatment facility in Batesville, Arkansas
linkA USGS water expert performs maintenance on a streamgage upstream of a water-treatment facility in Batesville, Arkansas on April 5, 2025.
USGS water expert performs maintenance on a streamgage upstream of a water-treatment facility in Batesville, Arkansas
linkA USGS water expert performs maintenance on a streamgage upstream of a water-treatment facility in Batesville, Arkansas on April 5, 2025.

National Groundwater Climate Response Network
Map of federally funded national groundwater Climate Response Network (CRN) sites. U.S. Climate divisions shaded in blue contain a CRN site; climate divisions in gray do not have a CRN site (as of 2025).
Map of federally funded national groundwater Climate Response Network (CRN) sites. U.S. Climate divisions shaded in blue contain a CRN site; climate divisions in gray do not have a CRN site (as of 2025).

How much water is there on Earth?
How much water is there? This side-by-side comparison illustrates Earth’s water, including total water, ocean water, frozen water, groundwater, and water in lakes & rivers.
How much water is there? This side-by-side comparison illustrates Earth’s water, including total water, ocean water, frozen water, groundwater, and water in lakes & rivers.

2025 Gage Greatness Final Bracket
At the USGS, we monitor our nation’s water. Our data informs many people, from kayakers to water managers. Gage Greatness allows any Instagram user to vote for their favorite gage (data collection station).
At the USGS, we monitor our nation’s water. Our data informs many people, from kayakers to water managers. Gage Greatness allows any Instagram user to vote for their favorite gage (data collection station).

Gage Greatness 2025 Finals bracket
The bracket for the Finals! New Jersey's and New Mexico's gages will compete to see whose gage is the greatest for Gage Greatest 2025.
The bracket for the Finals! New Jersey's and New Mexico's gages will compete to see whose gage is the greatest for Gage Greatest 2025.
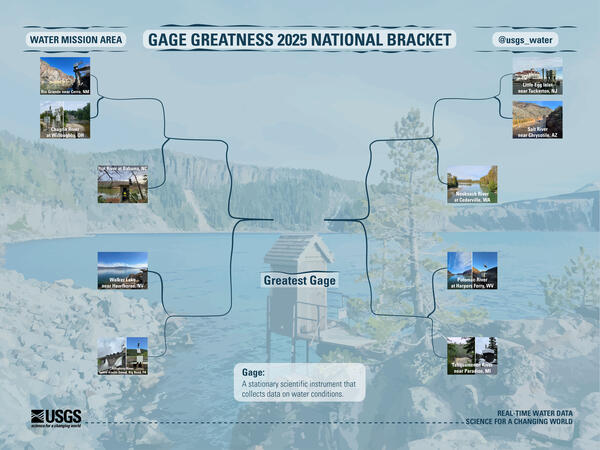
2025 Gage Greatness National Bracket Round One
At the USGS, we monitor our nation’s water. Our data informs many people, from kayakers to water managers. Gage Greatness allows any Instagram user to vote for their favorite gage (data collection station).
At the USGS, we monitor our nation’s water. Our data informs many people, from kayakers to water managers. Gage Greatness allows any Instagram user to vote for their favorite gage (data collection station).

U.S. Geological Survey PFAS Study Areas
Map of U.S. Geological Survey PFAS study areas. Specific points indicate: 1) Surface water and field studies (teal circles), 2) PFAS in tapwater studies (black circles), 3) PFAS in groundwater studies (orange circles), and 4) Sites where atmospheric samples were collected (yellow triangles).
Map of U.S. Geological Survey PFAS study areas. Specific points indicate: 1) Surface water and field studies (teal circles), 2) PFAS in tapwater studies (black circles), 3) PFAS in groundwater studies (orange circles), and 4) Sites where atmospheric samples were collected (yellow triangles).

WDFN Current Conditions Table How to
Screenshot from Water Data for the Nation video on "How to make a current conditions table using new state pages and My Favorites list"
Screenshot from Water Data for the Nation video on "How to make a current conditions table using new state pages and My Favorites list"

WDFN: How to Show Daily Values on Monitoring Location Pages
Water Data for the Nation: How to Show Daily Values on Monitoring Location Pages video thumbnail
Water Data for the Nation: How to Show Daily Values on Monitoring Location Pages video thumbnail

High Flow being measured at Hurricane Creek
USGS hydrologic technician Fred Brogan holds an acoustic doppler current profiler (ADCP) while measuring the highest flow measured to-date on Hurricane Creek at Hurricane, WV. Photo by Logan Jarrell, USGS Hydrologic Technician
USGS hydrologic technician Fred Brogan holds an acoustic doppler current profiler (ADCP) while measuring the highest flow measured to-date on Hurricane Creek at Hurricane, WV. Photo by Logan Jarrell, USGS Hydrologic Technician

Thumbnail of Introductory slide for USGS Water Resources Mission Area public webinar, NWISWEB Decommission – Campaign 1
linkThumbnail of Introductory slide for USGS Water Resources Mission Area public webinar, NWISWEB Decommission – Campaign 1.
Thumbnail of Introductory slide for USGS Water Resources Mission Area public webinar, NWISWEB Decommission – Campaign 1
linkThumbnail of Introductory slide for USGS Water Resources Mission Area public webinar, NWISWEB Decommission – Campaign 1.

Thumbnail for the National Water Availability Assessment Release
Thumbnail image for the Water Resources Mission Area National Water Availability Assessment Release
Thumbnail image for the Water Resources Mission Area National Water Availability Assessment Release

Graphs showing water-year total precipitation and air temperatures in the Lower Colorado River Basin from 1896 to 2019
linkGraphs showing water-year total precipitation and air temperatures in the Lower Colorado River Basin from 1896 to 2019, units modified from millimeters to inches of precipitation and from degrees Celsius to degrees Fahrenheit from: Tillman, F.D., Gangopadhyay, S., and Pruitt, T., 2020, Trends in recent historical and projected climate data for the Colorado River Bas
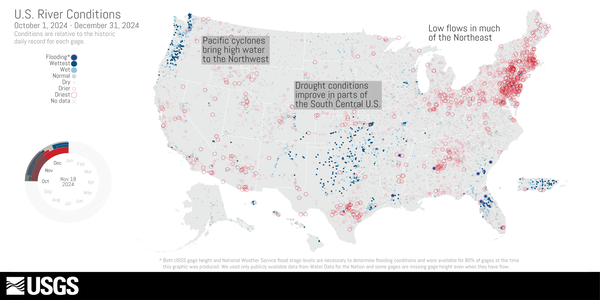
U.S. River Conditions, October to December 2024
U.S. River Conditions, October to December 2024 thumbnail image. The river conditions shown range from the driest condition seen at a gage (red open circles) to the wettest (blue closed circles). A purple outer ring around a gage indicates it is flooding.
U.S. River Conditions, October to December 2024 thumbnail image. The river conditions shown range from the driest condition seen at a gage (red open circles) to the wettest (blue closed circles). A purple outer ring around a gage indicates it is flooding.

Pie chart showing proportions of major water use in Arizona in 2015
Pie chart showing proportions of major water uses (Agricultural, Municipal, Industrial, and Mining) in Arizona, USA, in 2015
Pie chart showing proportions of major water uses (Agricultural, Municipal, Industrial, and Mining) in Arizona, USA, in 2015

Cinnamon teal wearing a tracking backpack
Cinnamon teal with a GPS tracking backpack that weighs 10 grams, making it much more successful in staying on longer than heavier tracking devices.
Cinnamon teal with a GPS tracking backpack that weighs 10 grams, making it much more successful in staying on longer than heavier tracking devices.