
This image shows the cloud-water interception process in an island environment like the Hawaiian islands.
Multimedia
This multimedia gallery represents a collection of high-quality images, videos, webcams, posters, presentations, and documents produced by the Water Resources Mission Area.
Images

Water Cycle Image.jpg
This image shows the cloud-water interception process in an island environment like the Hawaiian islands.

Mean atmospheric precipitation and air temperature in the Lower Colorado River Basin, 1896-2019
linkGraphs showing mean annual precipitation and air temperature trends in the Lower Colorado River Basin, 1896-2019, published in: Tillman, F.D., Gangopadhyay, S., and Pruitt, T., 2020, Trends in recent historical and projected climate data for the Colorado River Basin and potential effects on groundwater availability: U.S.

Diagram of water flow for processing ore.jpg
Schematic diagram of water flow for processing ores at a conventional flotation plant and unlined tailings storage facility.
Schematic diagram of water flow for processing ores at a conventional flotation plant and unlined tailings storage facility.

Map of Colorado River Basin
Map of the Colorado River Basin in Wyoming, Colorado, Utah, Nevada, California, Arizona, and New Mexico
Map of the Colorado River Basin in Wyoming, Colorado, Utah, Nevada, California, Arizona, and New Mexico

Lower Colorado Basin Precipitation Temperature 1896-2019_graph.jpg
Graphs showing trends in atmospheric precipitation and air temperature in the Lower Colorado River Basin, 1896-2019
Graphs showing trends in atmospheric precipitation and air temperature in the Lower Colorado River Basin, 1896-2019

Graph showing trends in annual total precipitation and annual average air temperature in the Lower Colorado River Basin
linkGraphs showing trends in the sum of annual atmospheric precipitation and annual average air temperature in the Lower Colorado River Basin, 1896-2019
Graph showing trends in annual total precipitation and annual average air temperature in the Lower Colorado River Basin
linkGraphs showing trends in the sum of annual atmospheric precipitation and annual average air temperature in the Lower Colorado River Basin, 1896-2019
Videos

U.S. River Conditions, April to June 2024
This is an animation showing the changing conditions relative to the historic record of USGS streamgages from April 1, 2024 to June 30, 2024. The river conditions shown range from the driest condition seen at a gage (red open circles) to the wettest (blue closed circles). A purple outer ring around a gage indicates it is flooding.
This is an animation showing the changing conditions relative to the historic record of USGS streamgages from April 1, 2024 to June 30, 2024. The river conditions shown range from the driest condition seen at a gage (red open circles) to the wettest (blue closed circles). A purple outer ring around a gage indicates it is flooding.

Day in the Life of a USGS Physical Scientist
The USGS is home to many kinds of scientists studying the earth’s hydrology, topography, geography, geology, seismology, volcanology, and more.
In this video, we show you what a day is like for scientists studying a stream’s habitability.
The USGS is home to many kinds of scientists studying the earth’s hydrology, topography, geography, geology, seismology, volcanology, and more.
In this video, we show you what a day is like for scientists studying a stream’s habitability.

Hydrologic Instrumentation Research and Operations Chief Recruitment Information Session
We’re hiring!

U.S. River Conditions, January to March 2024
This is an animation showing the changing conditions relative to the historic record of USGS streamgages from January 1, 2024 to March 31, 2024. The river conditions shown range from the driest condition seen at a gage (red open circles) to the wettest (blue closed circles). A purple outer ring around a gage indicates it is flooding.
This is an animation showing the changing conditions relative to the historic record of USGS streamgages from January 1, 2024 to March 31, 2024. The river conditions shown range from the driest condition seen at a gage (red open circles) to the wettest (blue closed circles). A purple outer ring around a gage indicates it is flooding.

Accessing Samples and Water Quality 4/11/24 Webinar
The Water Data for the Nation (WDFN) team updated the public and other stakeholders on changes to USGS water quality and samples data access. Legacy access to water-quality and samples data are being retired, and new WDFN pages and features will provide access to discrete water quality and sample data.
The Water Data for the Nation (WDFN) team updated the public and other stakeholders on changes to USGS water quality and samples data access. Legacy access to water-quality and samples data are being retired, and new WDFN pages and features will provide access to discrete water quality and sample data.

U.S. River Conditions, October to December 2023
This is an animation showing the changing conditions relative to the historic record of USGS streamgages from October 1, 2023 to December 31, 2023. The river conditions shown range from the driest condition seen at a gage (red open circles) to the wettest (blue closed circles). A purple outer ring around a gage indicates it is flooding.
This is an animation showing the changing conditions relative to the historic record of USGS streamgages from October 1, 2023 to December 31, 2023. The river conditions shown range from the driest condition seen at a gage (red open circles) to the wettest (blue closed circles). A purple outer ring around a gage indicates it is flooding.
Audio

Eyes on Earth Episode 43 - U.S.-Canada Water Use
The St. Mary and Milk Rivers cross the U.S. and Canadian border and supply water to both countries. Managing that resource in the interest of both nations is a matter of international collaboration and cooperation, and Landsat data is helping offer objective information on water use.
The St. Mary and Milk Rivers cross the U.S. and Canadian border and supply water to both countries. Managing that resource in the interest of both nations is a matter of international collaboration and cooperation, and Landsat data is helping offer objective information on water use.

Responding to Hurricanes, Floods and Droughts in North Carolina
North Carolina, like many years before, is responding to flooding in the East and drought in the West. Holly Weyers, USGS North Carolina Water Science Center Director, discusses these extreme events.
North Carolina, like many years before, is responding to flooding in the East and drought in the West. Holly Weyers, USGS North Carolina Water Science Center Director, discusses these extreme events.

Groundwater Awareness Week is March 6-12
Groundwater is not a single vast pool of underground water; rather, it is contained within a variety of aquifer systems. Each of these aquifers has its own set of questions and challenges.
Groundwater is not a single vast pool of underground water; rather, it is contained within a variety of aquifer systems. Each of these aquifers has its own set of questions and challenges.
USGS Hydrologic Data Collection Program in North Carolina
USGS North Carolina Data Chief, Jeanne Robbins, provides an overview on hydrologic data collection techniques for North Carolina.
USGS North Carolina Data Chief, Jeanne Robbins, provides an overview on hydrologic data collection techniques for North Carolina.
Marking the Milestone, The Triangle Area Water Supply Monitoring Proj
USGS North Carolina Water Quality Specialist Mary Georgino discusses The Triangle Area Water Supply Monitoring Project.
USGS North Carolina Water Quality Specialist Mary Georgino discusses The Triangle Area Water Supply Monitoring Project.
Hurricane Floyd, and the Floods of 1999
USGS North Carolina Water Science Center Director Jerad Bales discusses Hurricane Floyd and flood impacts on North Carolina in 1999.
USGS North Carolina Water Science Center Director Jerad Bales discusses Hurricane Floyd and flood impacts on North Carolina in 1999.
Webcams
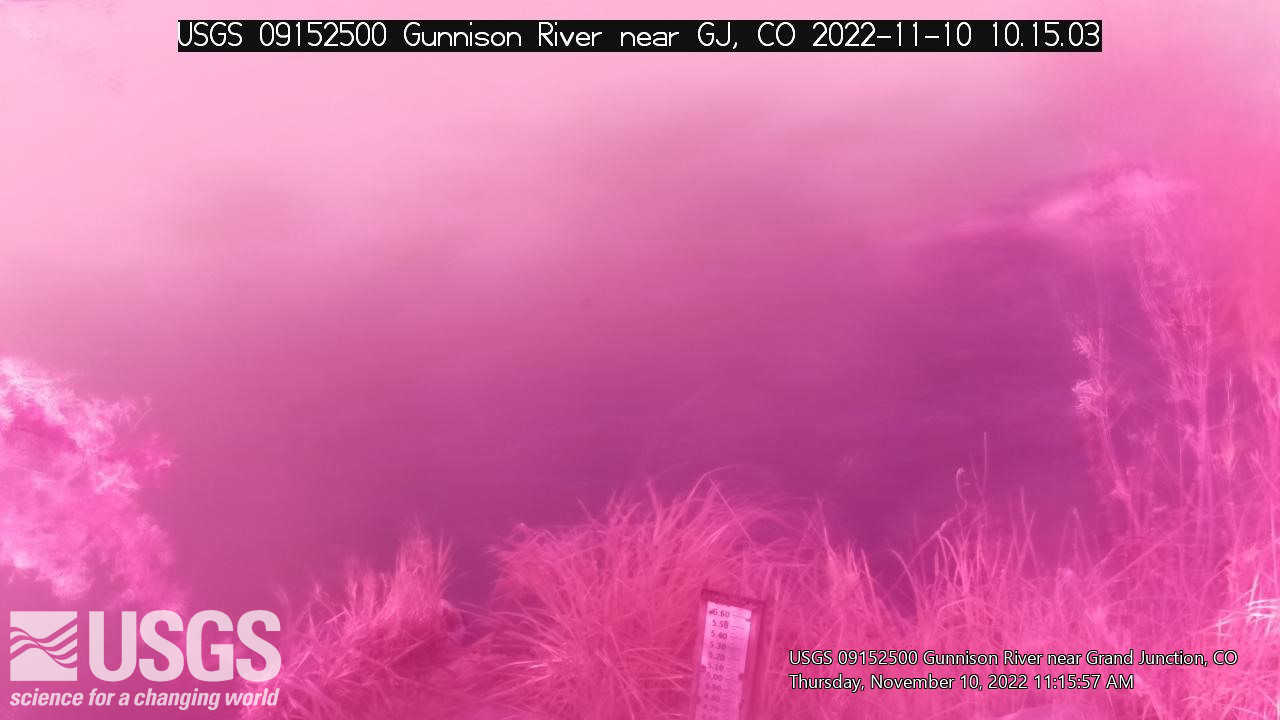
Streamgage 09152500 Gunnison River near Grand Junction, CO
Webcam at USGS Streamgage 09152500 Gunnison River near Grand Junction, CO.
Visit Water Data For the Nation to get current data for this site.
Webcam at USGS Streamgage 09152500 Gunnison River near Grand Junction, CO.
Visit Water Data For the Nation to get current data for this site.
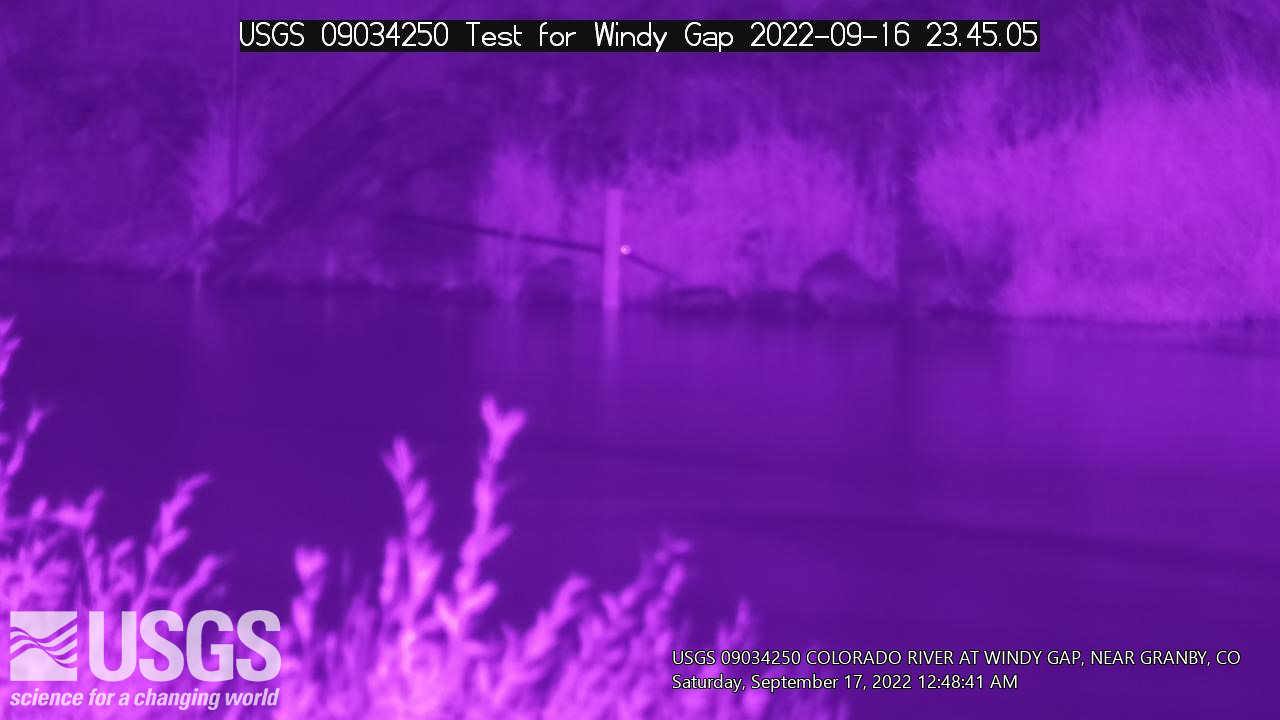
Streamgage 09034250 Colorado River at Windy Gap near Granby, CO
Webcam at USGS Streamgage 09034250 Colorado River at Windy Gap near Granby, CO.
Visit Water Data For the Nation to get current data for this site.
Webcam at USGS Streamgage 09034250 Colorado River at Windy Gap near Granby, CO.
Visit Water Data For the Nation to get current data for this site.
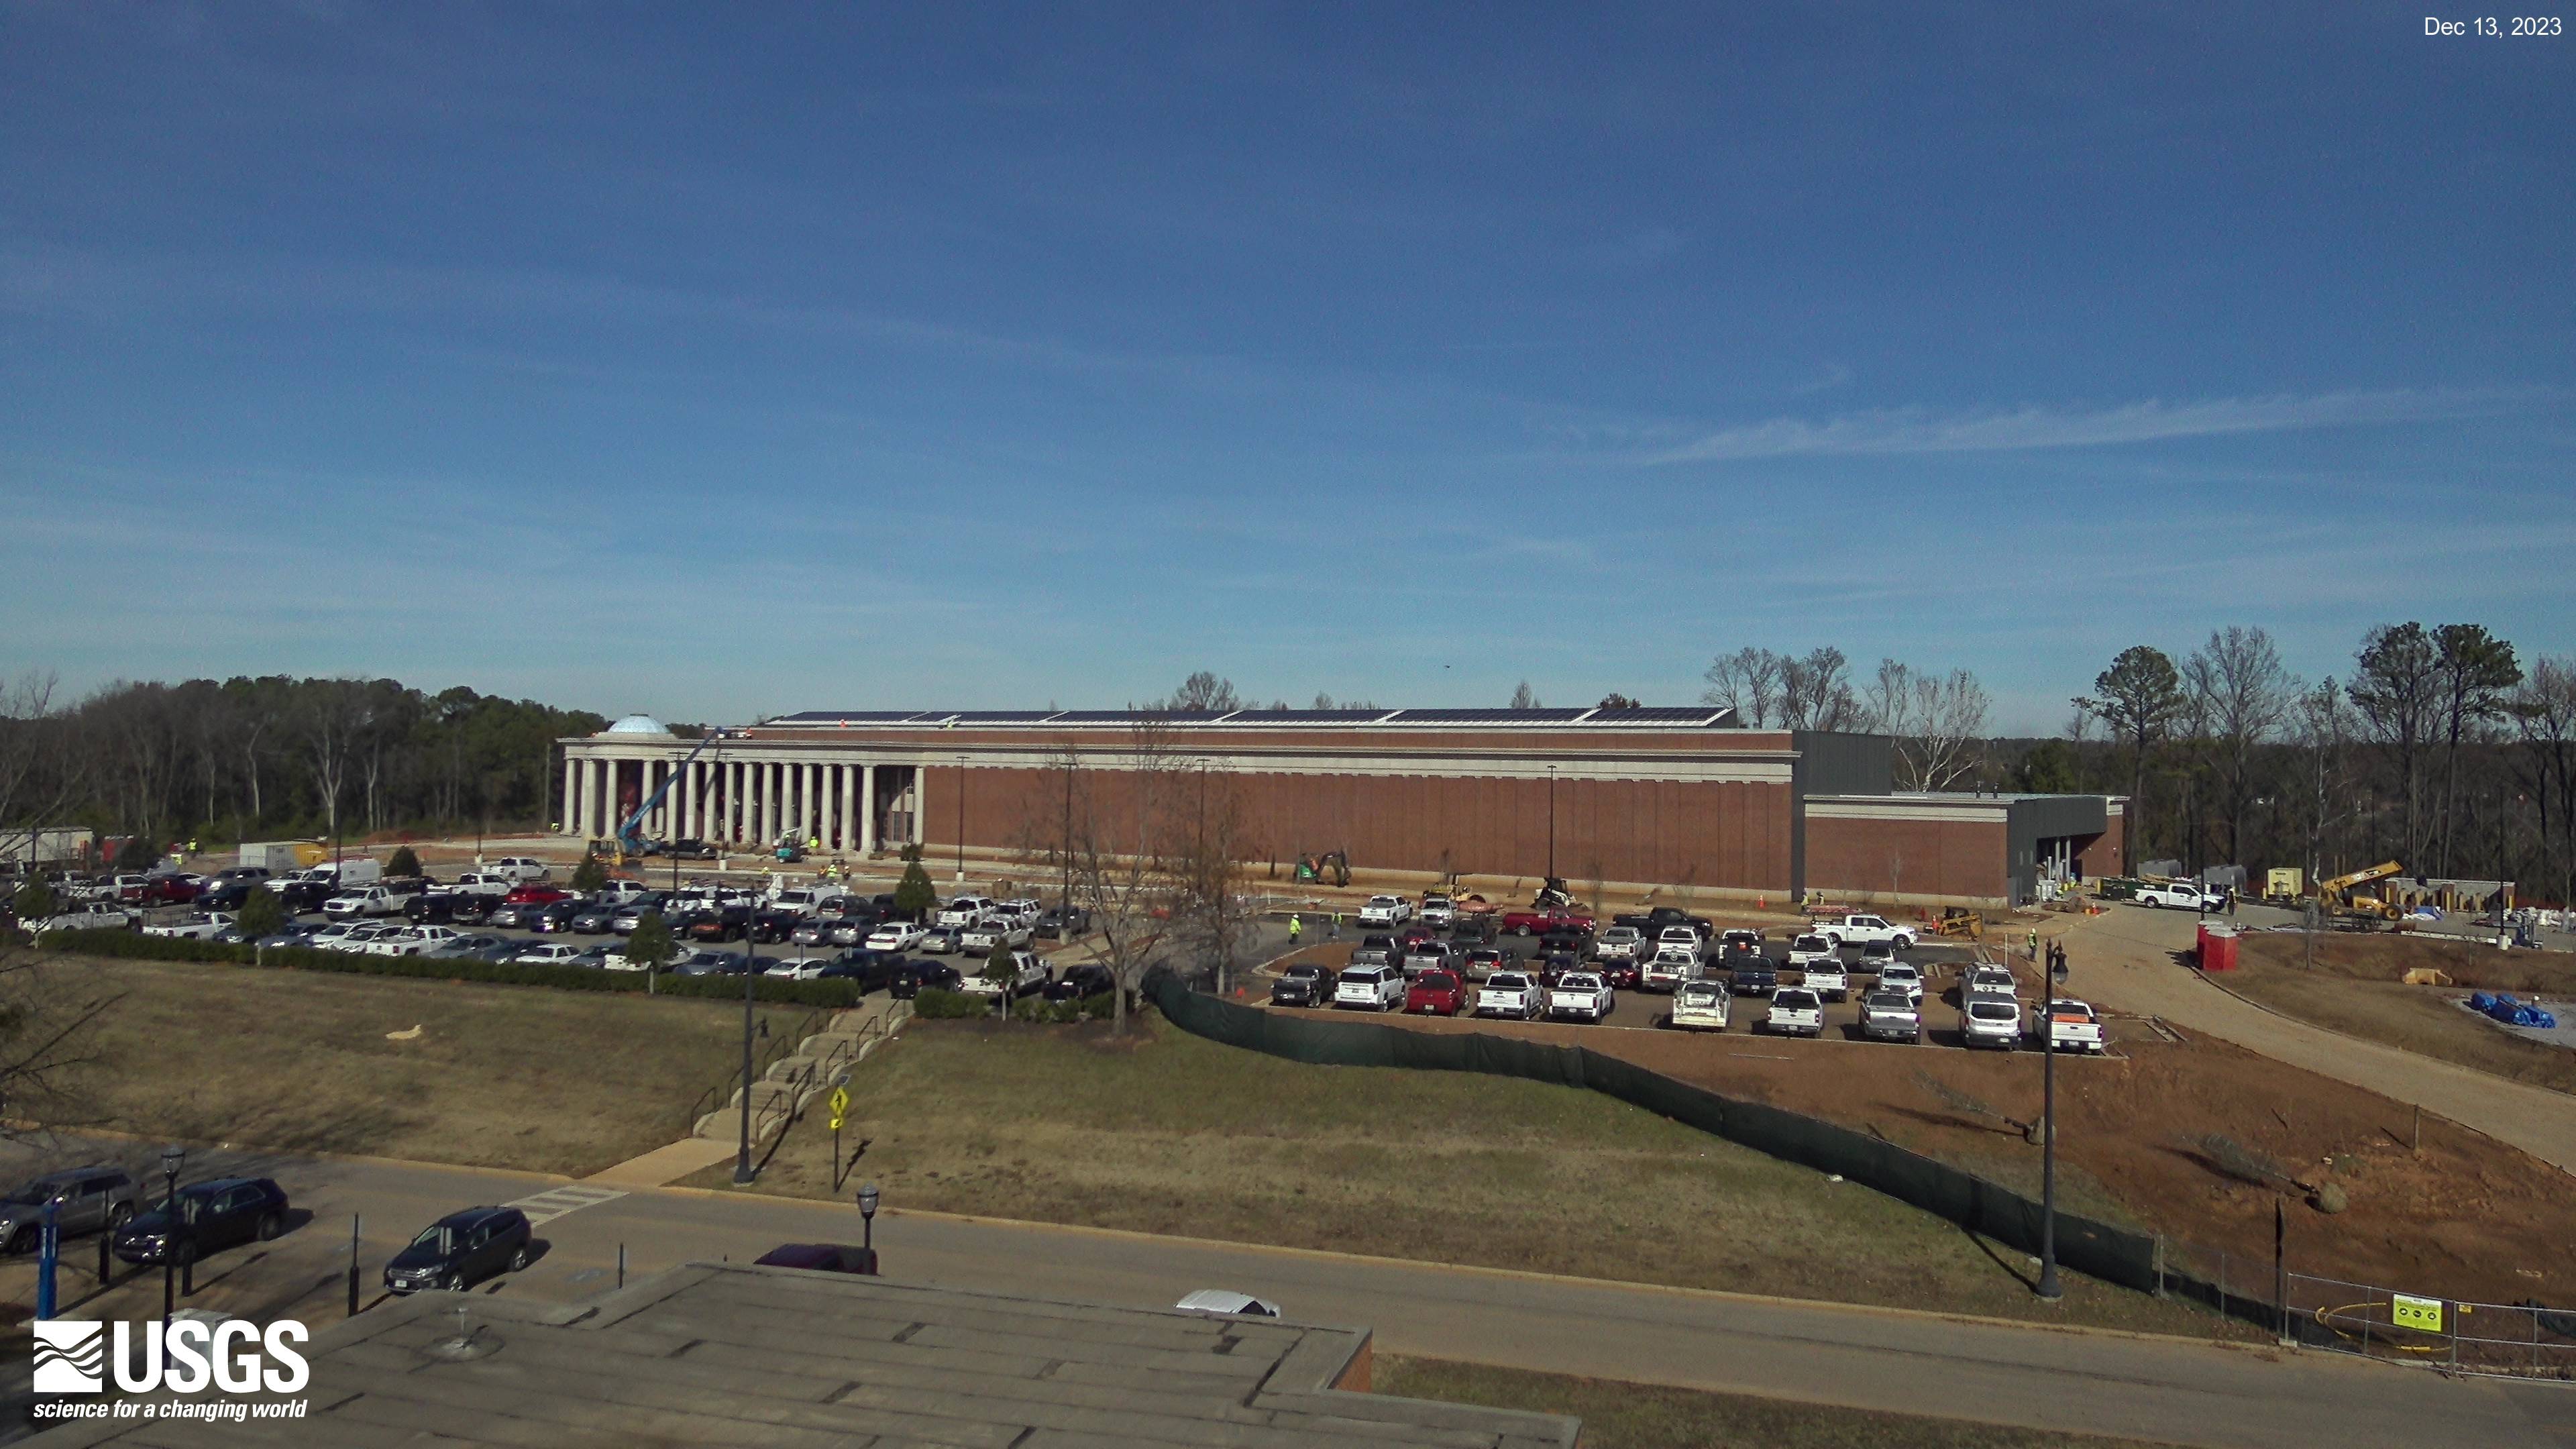
HIF Construction in Tuscaloosa, Alabama
The current view of construction progress at the new HIF facility in Tuscaloosa, Alabama.
The current view of construction progress at the new HIF facility in Tuscaloosa, Alabama.
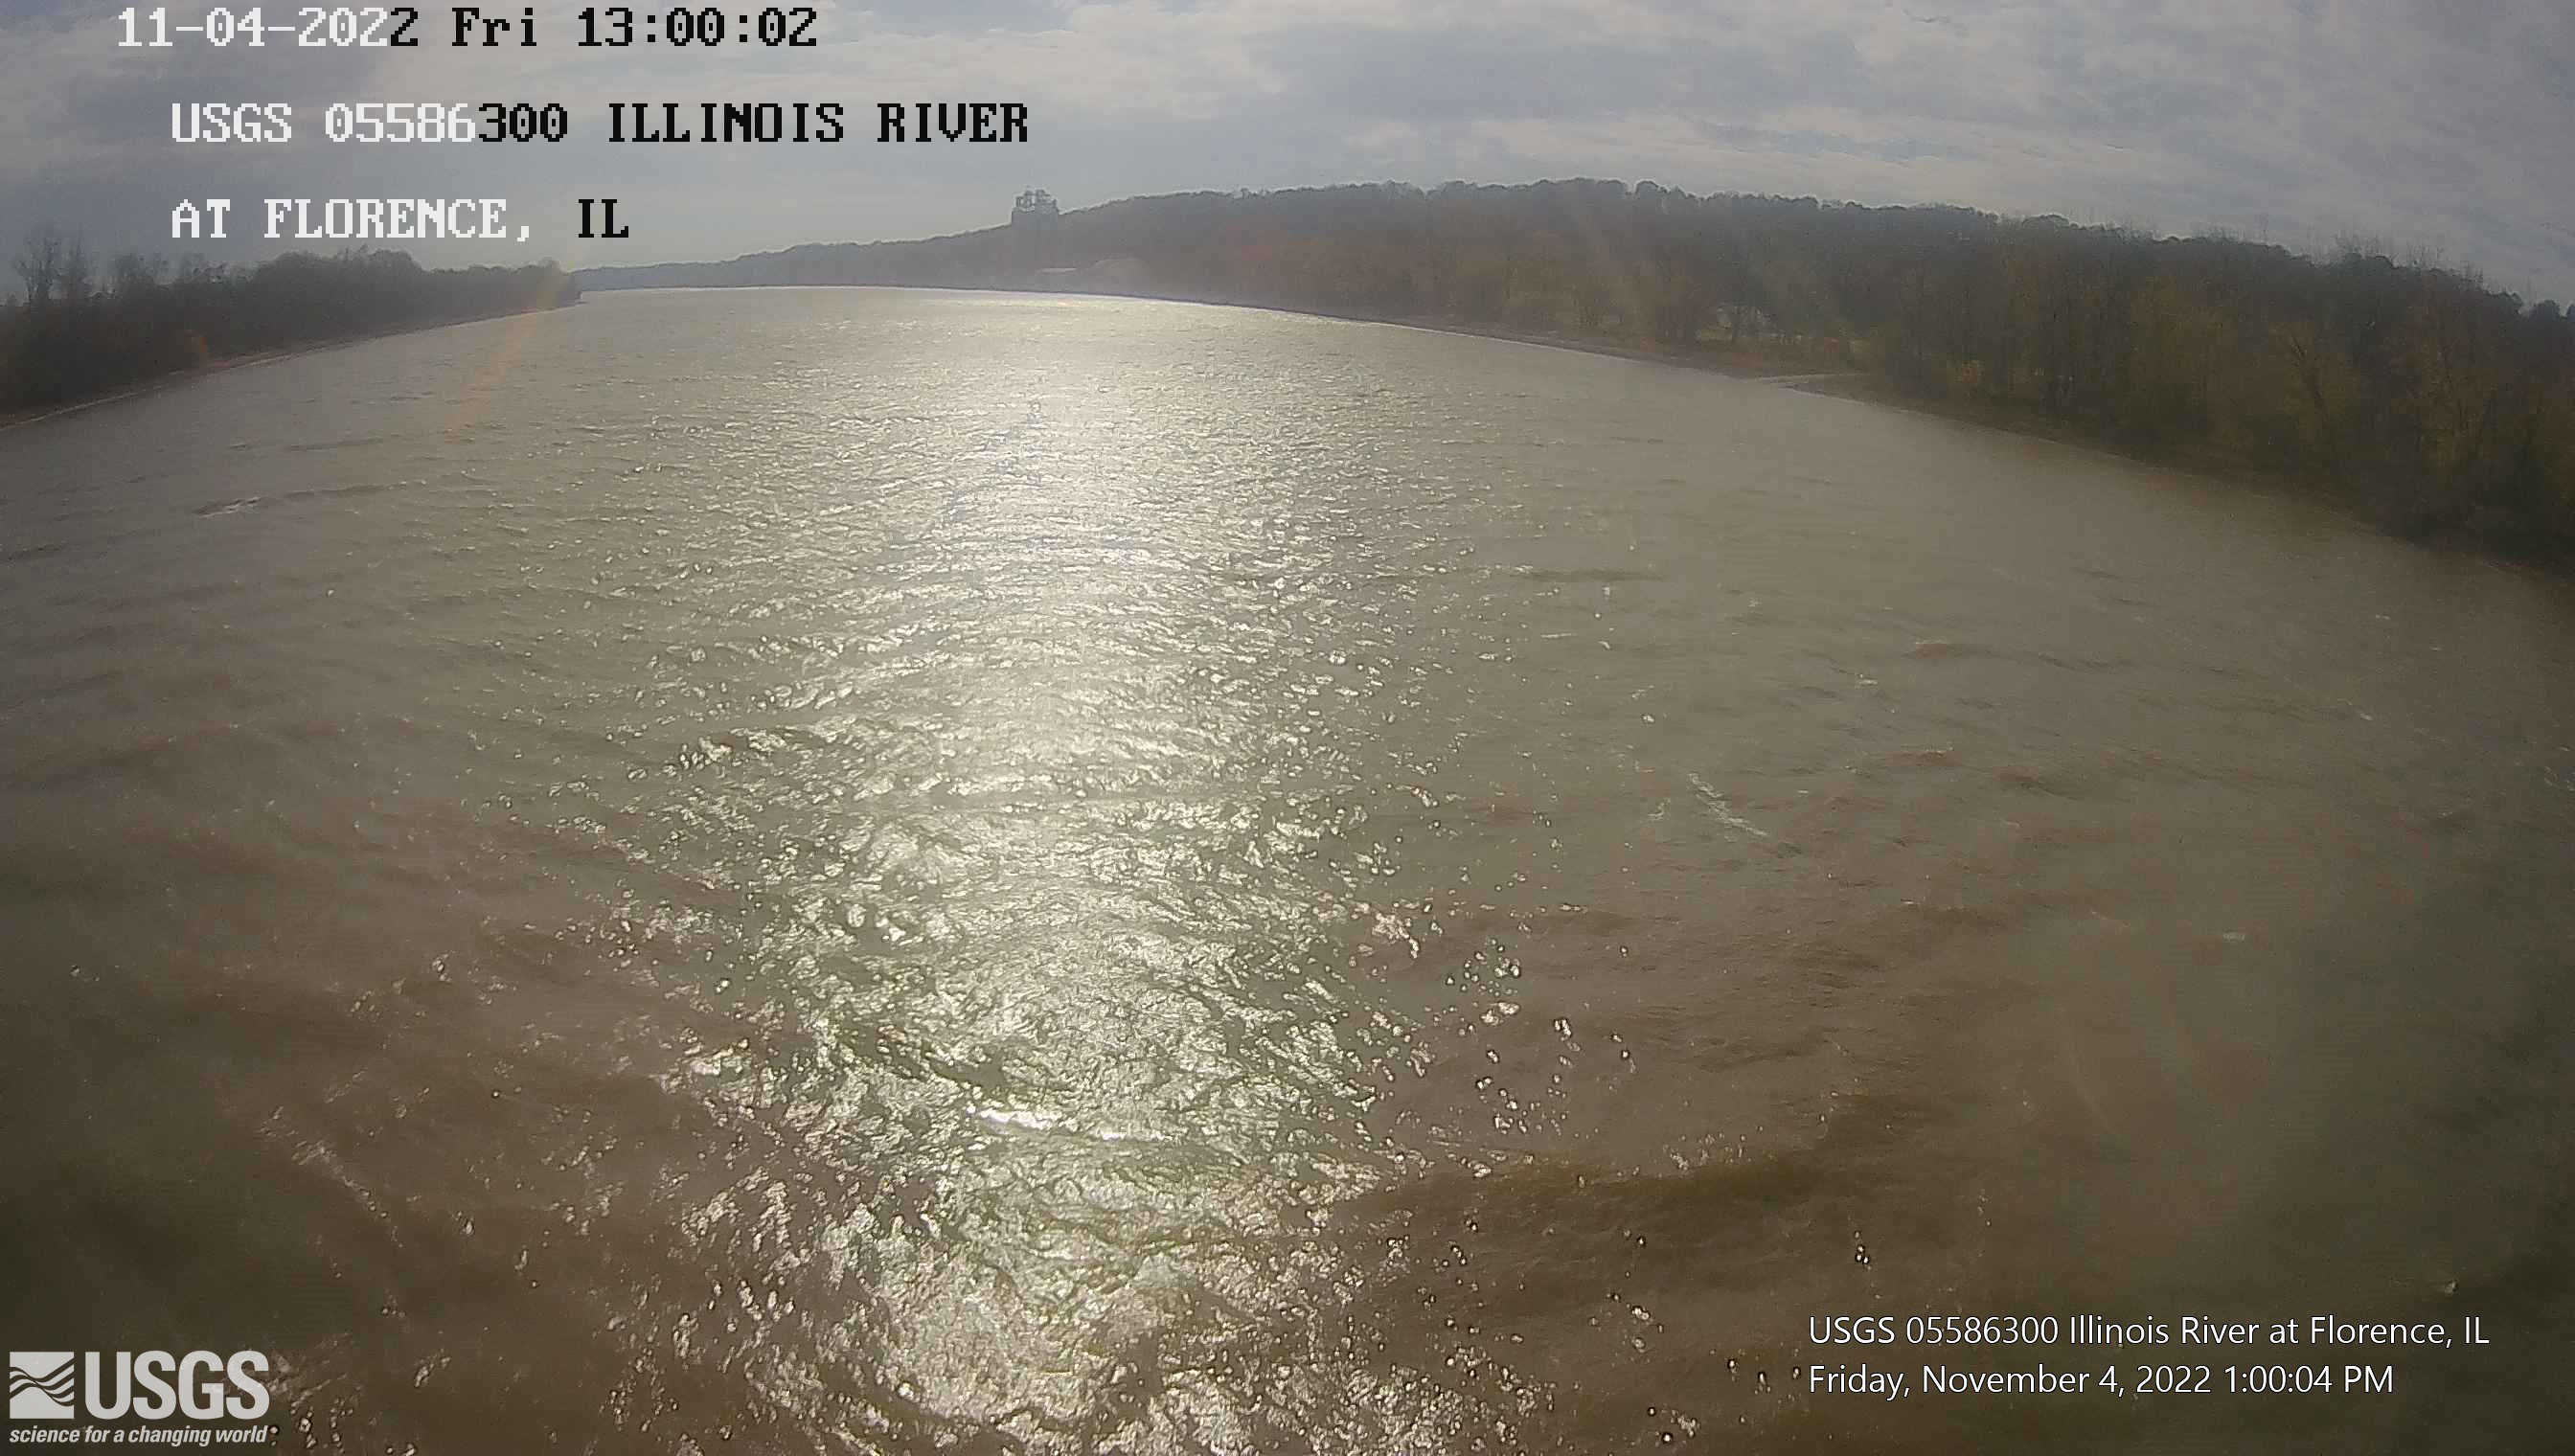
Streamgage 05586300 Illinois River at Florence, IL
Webcam at USGS Streamgage 05586300 Illinois River at Florence, IL.
Visit Water Data For the Nation to get current data for this site.
Webcam at USGS Streamgage 05586300 Illinois River at Florence, IL.
Visit Water Data For the Nation to get current data for this site.
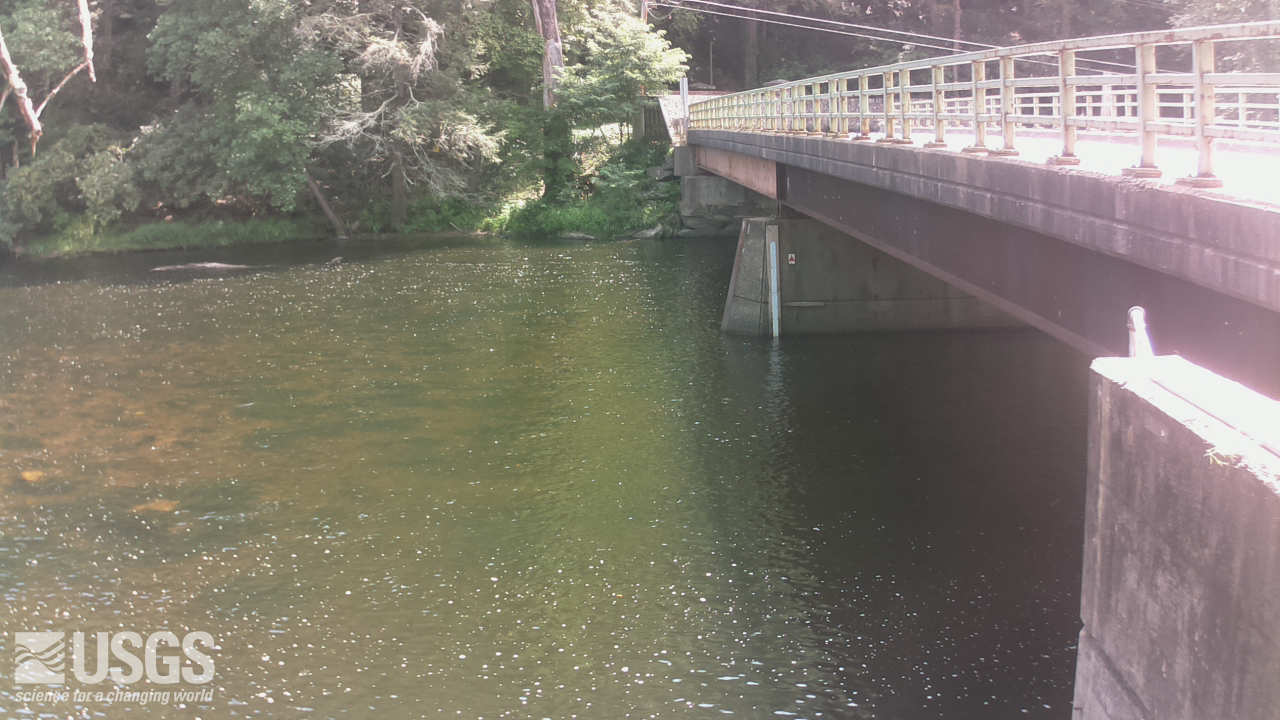
Streamgage 01437500 Neversink River at Godeffroy, NY
Webcam at USGS Streamgage 01437500 Neversink River at Godeffroy, NY.
Visit Water Data For the Nation to get current data for this site.
Webcam at USGS Streamgage 01437500 Neversink River at Godeffroy, NY.
Visit Water Data For the Nation to get current data for this site.
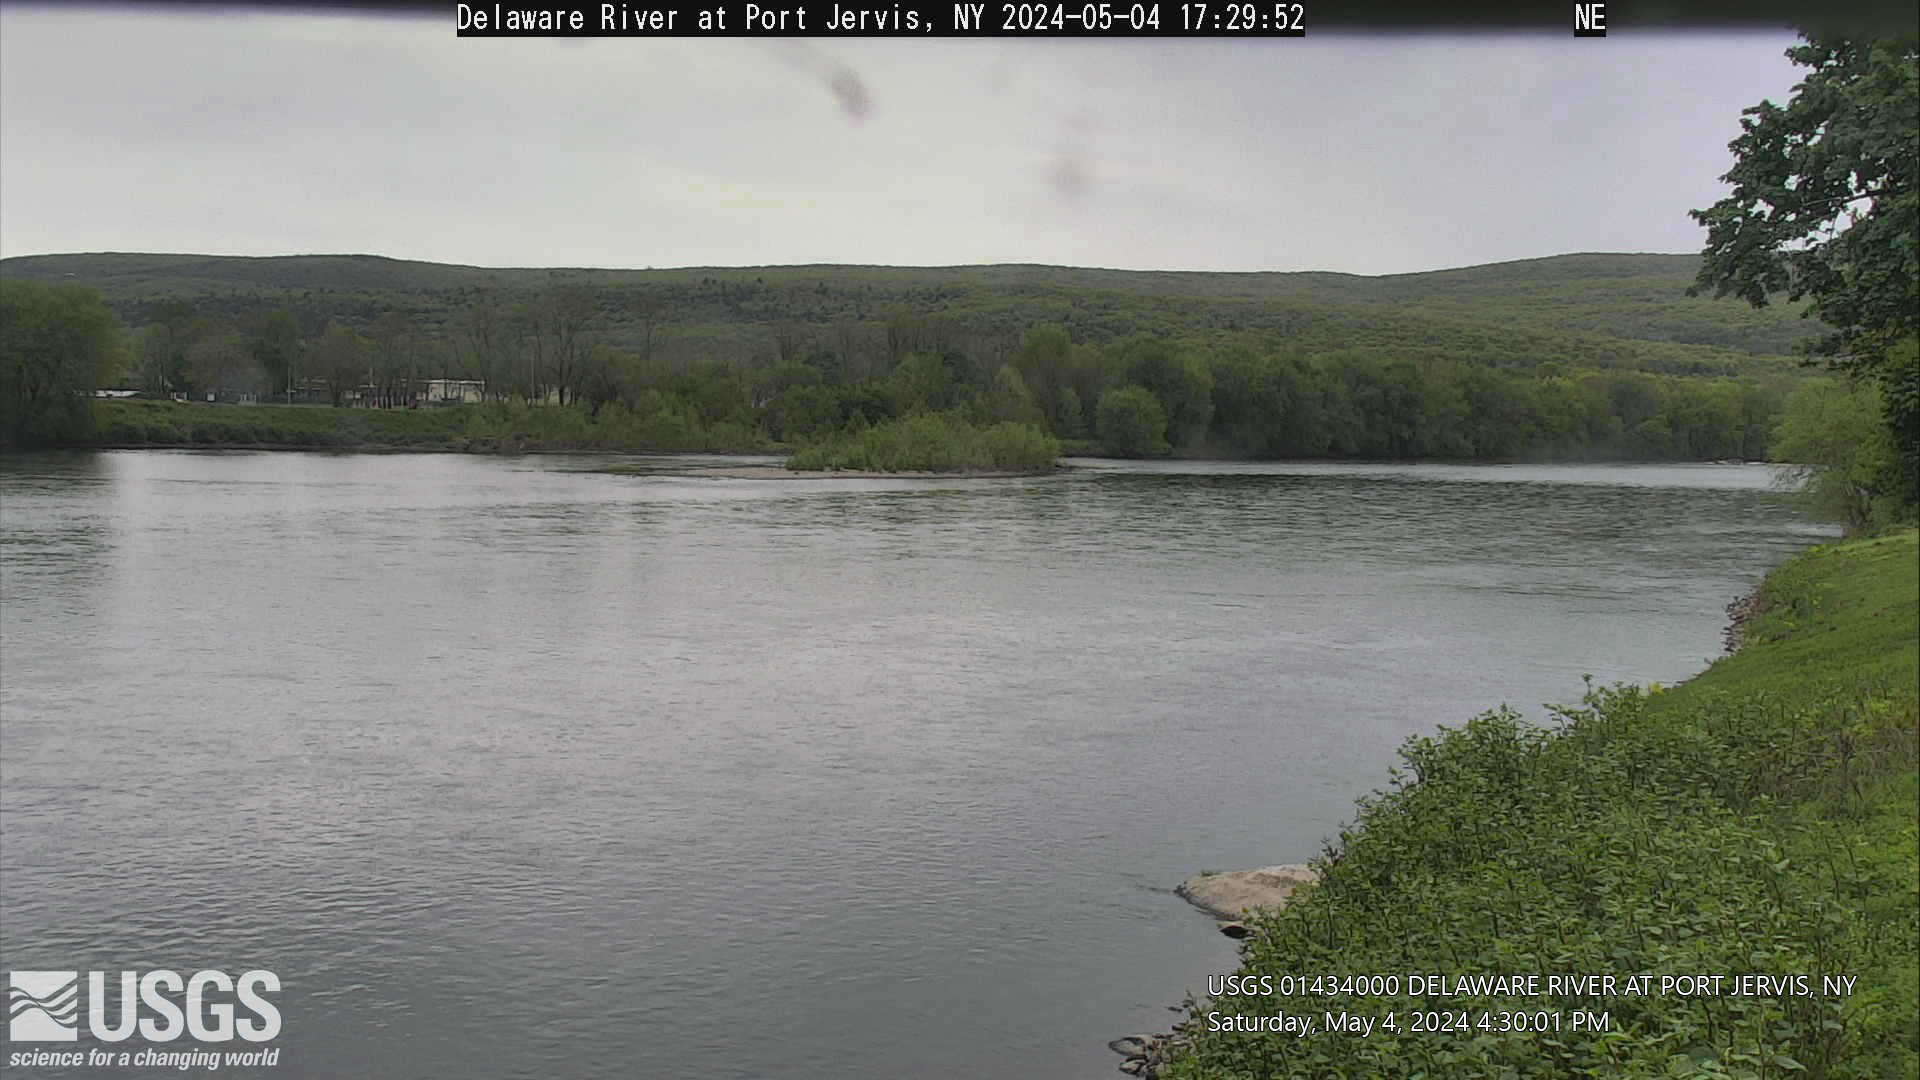
Streamgage 01434000 Delaware River at Port Jervis, NY
Webcam at USGS Streamgage 01434000 Delaware River at Port Jervis, NY.
Visit Water Data For the Nation to get current data for this site.
Webcam at USGS Streamgage 01434000 Delaware River at Port Jervis, NY.
Visit Water Data For the Nation to get current data for this site.