
Map of Yellowstone National Park showing the location of major travertine deposits. The green dashed line is the outline of Yellowstone Caldera and red lines are major paved roads.
Images
Images related to Yellowstone Volcano Observatory.
Filter Total Items: 546

Location of major travertine deposits in Yellowstone National Park
Map of Yellowstone National Park showing the location of major travertine deposits. The green dashed line is the outline of Yellowstone Caldera and red lines are major paved roads.

Travertine sample from Yellowstone National Park
Travertine sample from the Hillside Springs Group in Upper Geyser Basin, sampled under permit YELL-2020-SCI-8030. (Left) Cut and polished sample slab showing the different layers of travertine; dashed circles indicate where subsamples were taken for geochronology analysis.
Travertine sample from the Hillside Springs Group in Upper Geyser Basin, sampled under permit YELL-2020-SCI-8030. (Left) Cut and polished sample slab showing the different layers of travertine; dashed circles indicate where subsamples were taken for geochronology analysis.

Map of Yellowstone’s thermal areas
Map of Yellowstone’s thermal areas. Thermally active thermal areas (known to have thermal features with above-background temperatures) are shown in red. Inactive and cold, degassing thermal areas are shown in blue. Areas that are unknown or inconclusive in terms of their thermal activity are shown in purple.
Map of Yellowstone’s thermal areas. Thermally active thermal areas (known to have thermal features with above-background temperatures) are shown in red. Inactive and cold, degassing thermal areas are shown in blue. Areas that are unknown or inconclusive in terms of their thermal activity are shown in purple.

Visible/thermal maps of Brimstone Basin & Midway/Lower Geyser Basins
Visible and thermal maps of Brimstone Basin (top) and Midway / Lower Geyser Basins (bottom). The images on the left are high-resolution (1-m pixels) visible images acquired by the NAIP program in 2019. In these images, the extent of the bright white surface cover is visual evidence for the thermal area, and the yellow thermal area boundaries have been di
Visible and thermal maps of Brimstone Basin (top) and Midway / Lower Geyser Basins (bottom). The images on the left are high-resolution (1-m pixels) visible images acquired by the NAIP program in 2019. In these images, the extent of the bright white surface cover is visual evidence for the thermal area, and the yellow thermal area boundaries have been di

March 30, 2021 — Kīlauea
This photo was taken from the western caldera rim, and looks down up on the western fissure supplying lava into the lake in Halema‘uma‘u, at the summit of Kīlauea. Incandescence is visible in a small vent opening in the lower left portion of the image. In the upper right, the lava stream at the lake inlet slowly flows eastward. USGS photo by M. Patrick.
This photo was taken from the western caldera rim, and looks down up on the western fissure supplying lava into the lake in Halema‘uma‘u, at the summit of Kīlauea. Incandescence is visible in a small vent opening in the lower left portion of the image. In the upper right, the lava stream at the lake inlet slowly flows eastward. USGS photo by M. Patrick.

March 30, 2021 — Kīlauea
This photo shows Halema‘uma‘u Crater from the western caldera rim, looking east. Active surface lava is limited to the western portion of the lake, and can be seen as the silvery surface just below the center of the image. The eastern portion of the lake is solidified at the surface, and is visible just above the center. USGS photo by M. Patrick.
This photo shows Halema‘uma‘u Crater from the western caldera rim, looking east. Active surface lava is limited to the western portion of the lake, and can be seen as the silvery surface just below the center of the image. The eastern portion of the lake is solidified at the surface, and is visible just above the center. USGS photo by M. Patrick.

March 30, 2021 — Kīlauea
The western fissure remains active, supplying lava to the lava lake in Halema‘uma‘u Crater, at the summit of Kīlauea. This photo shows a close-up of the inlet where lava enters the lake. The motion of the lava stream has been slow but continuous. USGS photo by M. Patrick.
The western fissure remains active, supplying lava to the lava lake in Halema‘uma‘u Crater, at the summit of Kīlauea. This photo shows a close-up of the inlet where lava enters the lake. The motion of the lava stream has been slow but continuous. USGS photo by M. Patrick.

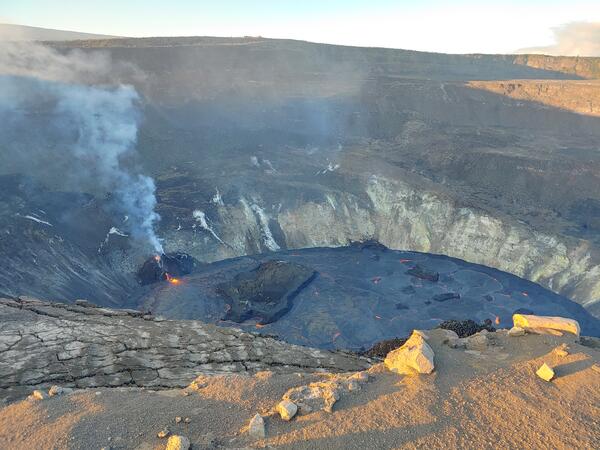
March 29, 2021 — Kīlauea
The lava lake in Halema‘uma‘u crater, at the summit of Kīlauea, remains active. The active surface lava lake, shown in this photo, is limited to the western portion of the lake between the western fissure complex (center left) and the main island (right).
The lava lake in Halema‘uma‘u crater, at the summit of Kīlauea, remains active. The active surface lava lake, shown in this photo, is limited to the western portion of the lake between the western fissure complex (center left) and the main island (right).

Outline of the Steamboat and Cistern plumbing systems from seismicity
Outline of the Steamboat and Cistern plumbing systems, with two viewing angles. The structure, color-coded by depth, delineates the observed seismically active area during eruption cycles of Steamboat Geyser. The solid star, solid square, and open triangles denote Steamboat Geyser, Cistern Spring, and seismic station locations on the surface, respectively.
Outline of the Steamboat and Cistern plumbing systems, with two viewing angles. The structure, color-coded by depth, delineates the observed seismically active area during eruption cycles of Steamboat Geyser. The solid star, solid square, and open triangles denote Steamboat Geyser, Cistern Spring, and seismic station locations on the surface, respectively.

Seismic view of Steamboat Geyser and Cistern Spring
Outline of the Steamboat and Cistern plumbing systems. The structure, color-coded by depth, delineates the observed seismically active area during eruption cycles of Steamboat Geyser. The solid star, solid square, and open triangles denote Steamboat Geyser, Cistern Spring, and seismic station locations on the surface, respectively.
Outline of the Steamboat and Cistern plumbing systems. The structure, color-coded by depth, delineates the observed seismically active area during eruption cycles of Steamboat Geyser. The solid star, solid square, and open triangles denote Steamboat Geyser, Cistern Spring, and seismic station locations on the surface, respectively.

Crinoid fossil from northern Yellowstone National Park
Crinoid fossil from a Paleozoic rock unit found in northern Yellowstone National Park.
Crinoid fossil from a Paleozoic rock unit found in northern Yellowstone National Park.

Example of new layers in the Geology of Yellowstone Map
Example of some of the new layers available in the Geology of Yellowstone Map as of early 2021. Shown here are the locations of various monitoring instruments and water sample sites overlain on a thermal infrared satellite image. Lighter colors on the infrared image show more radiant (warmer) areas, whereas dark areas are less radiant (cooler).
Example of some of the new layers available in the Geology of Yellowstone Map as of early 2021. Shown here are the locations of various monitoring instruments and water sample sites overlain on a thermal infrared satellite image. Lighter colors on the infrared image show more radiant (warmer) areas, whereas dark areas are less radiant (cooler).

Seismic data available from online Geology of Yellowstone Map
Seismic stations (white triangles) around Yellowstone Lake as seen on the online Geology of Yellowstone Map. Inset shows a seismogram for station YLA that can be accessed by clicking on the feature and following the “Seismogram” link in the popup box.
Seismic stations (white triangles) around Yellowstone Lake as seen on the online Geology of Yellowstone Map. Inset shows a seismogram for station YLA that can be accessed by clicking on the feature and following the “Seismogram” link in the popup box.

Rhyolite alteration viewed by a Scanning Electron Microscope
Photos from a Scanning Electron Microscope (SEM) showing reacted rhyolite fragments at the end of the laboratory experiments. (a) Image magnified by 500 times showing the rhyolite after it reacted with water at 250 degrees Celsius (482 F). The reacted rhyolite fragments show very little change compared with the unreacted fragments.
Photos from a Scanning Electron Microscope (SEM) showing reacted rhyolite fragments at the end of the laboratory experiments. (a) Image magnified by 500 times showing the rhyolite after it reacted with water at 250 degrees Celsius (482 F). The reacted rhyolite fragments show very little change compared with the unreacted fragments.

Mudpot located near Mud Volcano in Yellowstone National Park
Mudpot located in the Mud Volcano thermal area of Yellowstone National Park. This type of thermal feature indicates an acid-sulfate system.
Mudpot located in the Mud Volcano thermal area of Yellowstone National Park. This type of thermal feature indicates an acid-sulfate system.

Steam vents along the Yellowstone River near Mud Volcano thermal area
Steam vents along the Yellowstone River near Mud Volcano thermal area, Yellowstone National Park.
Steam vents along the Yellowstone River near Mud Volcano thermal area, Yellowstone National Park.

Thermal anomaly map of Yellowstone National Park based on a Landsat 8 nighttime thermal infrared image from 9 January 2021
linkThermal anomaly map of Yellowstone National Park, based on a Landsat 8 nighttime thermal infrared image from 9 January 2021. The color ramp indicates the intensity of the above-background thermal anomaly for each thermal area. Lakes are blue. Yellowstone caldera and resurgent domes are outlined in black.

Columbia River Basalts seen at Steens Mountain, Oregon
Looking southwest from the Steens Mountain summit area into the Alvord desert of eastern Oregon. This fault-block escarpment reveals the oldest lava flows of the Columbia River Flood Basalts, which erupted about 17 million years ago. Three or four vertical dikes that feed these flows are evident in the midground ridge where they stand as rock walls cutti
Looking southwest from the Steens Mountain summit area into the Alvord desert of eastern Oregon. This fault-block escarpment reveals the oldest lava flows of the Columbia River Flood Basalts, which erupted about 17 million years ago. Three or four vertical dikes that feed these flows are evident in the midground ridge where they stand as rock walls cutti
Halema‘uma‘u lava lake on the evening of 5 January, 2021
View looking north across Kīlauea caldera from the south rim of Halema‘uma‘u, showing the ongoing eruption around 5:30 p.m. HST on January 5, 2021. The west vent activity included the “dome fountain,” effusive lava flows from a mid-elevation vent, and weak strombolian spattering activity from the high-elevation vent. USGS photo by K. Lynn.
View looking north across Kīlauea caldera from the south rim of Halema‘uma‘u, showing the ongoing eruption around 5:30 p.m. HST on January 5, 2021. The west vent activity included the “dome fountain,” effusive lava flows from a mid-elevation vent, and weak strombolian spattering activity from the high-elevation vent. USGS photo by K. Lynn.

Halema‘uma‘u west vent activity for the evening of 5 January, 2021
Telephoto view of the lava flow and “dome fountain” activity at the west vent of the ongoing eruption in Halema‘uma‘u, Kīlauea Volcano summit, at 5:45 p.m. HST on 5 January, 2021. USGS photo by K. Lynn.
Telephoto view of the lava flow and “dome fountain” activity at the west vent of the ongoing eruption in Halema‘uma‘u, Kīlauea Volcano summit, at 5:45 p.m. HST on 5 January, 2021. USGS photo by K. Lynn.

Eruptions of Steamboat Geyser over time
Eruptions of Steamboat Geyser over time. (A) Cumulative eruptions of Steamboat Geyser since 1960. Each dot represents an eruption. (B) Comparative plot of the cumulative eruptions in each active phase (1960s, 1980s, and 2018-). Data from GeyserTimes.
Eruptions of Steamboat Geyser over time. (A) Cumulative eruptions of Steamboat Geyser since 1960. Each dot represents an eruption. (B) Comparative plot of the cumulative eruptions in each active phase (1960s, 1980s, and 2018-). Data from GeyserTimes.