
Mike Poland, Scientist-in-Charge of the Yellowstone Volcano Observatory, describes activity at Yellowstone during the month of June, 2019.
Michael Poland
Mike Poland is a research geophysicist with the Cascades Volcano Observatory and the current Scientist-in-Charge of the Yellowstone Volcano Observatory.
Mike's area of specialization is volcano geodesy, which emphasizes the surface deformation and gravity fields associated with volcanic activity. This work involves the use of space-based technologies, like Interferometric Synthetic Aperture Radar (InSAR), as well as ground-based techniques, like microgravity surveys. Mike has taken part in studies on a variety of volcanic systems in the United States, including Mount St. Helens and other volcanoes of the Pacific Northwest, Kilauea and Mauna Loa volcanoes in Hawaii, and the Yellowstone caldera. His recent work has focused on using gravity change over time to understand the character of the fluids that drive volcanic unrest, and also on the potential of satellite data to improve forecasts of future changes in volcanic activity.
Science and Products
Filter Total Items: 119

Yellowstone Volcano Observatory Monthly Update: July 1, 2019
Mike Poland, Scientist-in-Charge of the Yellowstone Volcano Observatory, describes activity at Yellowstone during the month of June, 2019.

Yellowstone Volcano Observatory Monthly Update: June 3, 2019
Mike Poland, Scientist-in-Charge of the Yellowstone Volcano Observatory, describes activity at Yellowstone during the month of May, 2019.
Mike Poland, Scientist-in-Charge of the Yellowstone Volcano Observatory, describes activity at Yellowstone during the month of May, 2019.

Deformation near South Sister from GPS data, 2001-2017
Horizontal displacements from campaign (black vectors) and continuous (red vectors, with station names given) GPS stations, as well as vertical displacements (indicated by color of GPS station symbol) near South Sister, Oregon. Length of arrow gives amount of horizontal displacement, with scale in lower left showing an arrow length
Horizontal displacements from campaign (black vectors) and continuous (red vectors, with station names given) GPS stations, as well as vertical displacements (indicated by color of GPS station symbol) near South Sister, Oregon. Length of arrow gives amount of horizontal displacement, with scale in lower left showing an arrow length

Time series of vertical displacements during April–October 2017 at four GPS stations on the north side of Yellowstone Lake
linkTime series of vertical displacements during April–October 2017 at four GPS stations (LAK1, LAK2, LKWY, and SEDG) on the north side of Yellowstone Lake. Downward trends indicate subsidence and upward trends show uplift. Uplift “spikes” in late September are related to inclement weather and do not show true deformation. Error bars are one standard deviation.

InSAR image Kīlauea, Hawai‘i, Mar. 2011 shows ground surface deflat...
InSAR image Kīlauea, Hawai‘i, Mar. 2011. Kamoamoa fissure trace is indicated by the red line.
InSAR image Kīlauea, Hawai‘i, Mar. 2011. Kamoamoa fissure trace is indicated by the red line.

Map of Kīlauea showing the south-SE motion, as recorded by continuo...
Map of Kīlauea Volcano showing the south-southeast motion, as recorded by continuous GPS sites (arrows), and earthquake epicenter between February 1-3, 2010.
Map of Kīlauea Volcano showing the south-southeast motion, as recorded by continuous GPS sites (arrows), and earthquake epicenter between February 1-3, 2010.

Lava Enters The Ocean At Kilauea Volcano, Hawai'i
Lava from the Pu'u 'Ō'ō-Kupaianaha eruption, active since 1983, enters the ocean on the south flank of Kīlauea Volcano.
Lava from the Pu'u 'Ō'ō-Kupaianaha eruption, active since 1983, enters the ocean on the south flank of Kīlauea Volcano.

An inquisitive Yellow-bellied Marmot stands on its hind legs, in Yellowstone National Park.
Yellow-bellied Marmot stands on its hind legs in Yellowstone National Park. Photo by D. Dzurisin.
Yellow-bellied Marmot stands on its hind legs in Yellowstone National Park. Photo by D. Dzurisin.
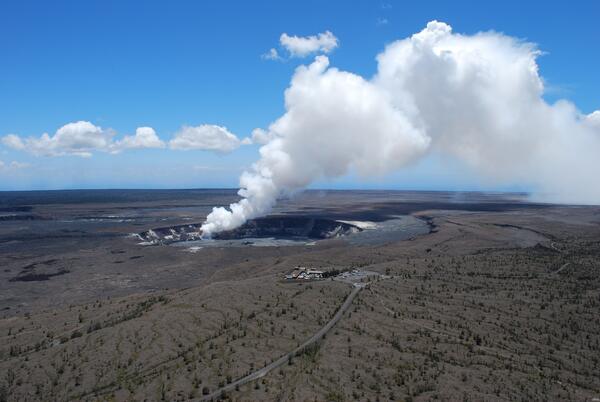
The USGS Hawaiian Volcano Observatory Monitors Kilauea's Summit Eruption
The USGS Hawaiian Volcano Observatory (foreground) is located on the caldera rim of Kilauea Volcano, Hawai'ithe most active volcano in the world. The observatory's location provides an excellent view of summit eruptive activity, which began in 2008.
The USGS Hawaiian Volcano Observatory (foreground) is located on the caldera rim of Kilauea Volcano, Hawai'ithe most active volcano in the world. The observatory's location provides an excellent view of summit eruptive activity, which began in 2008.

USGS Hawaiian Volcano Observatory Monitors Kilauea's Summit Eruption
The USGS Hawaiian Volcano Observatory (foreground) is located on the caldera rim of Kilauea Volcano, Hawai'i—the most active volcano in the world. The observatory's location provides an excellent view of summit eruptive activity, which began in 2008.
The USGS Hawaiian Volcano Observatory (foreground) is located on the caldera rim of Kilauea Volcano, Hawai'i—the most active volcano in the world. The observatory's location provides an excellent view of summit eruptive activity, which began in 2008.

Littoral Explosion At Kilauea Volcano, Hawai'i
When lava from the Pu'u 'Ō'ō-Kupaianaha eruption, active since 1983, meets the ocean, large littoral explosions can result.
When lava from the Pu'u 'Ō'ō-Kupaianaha eruption, active since 1983, meets the ocean, large littoral explosions can result.

South side of Mount St. Helens lava dome, glacier
South side of Mount St. Helens lava dome, glacier (cracked snowy surface in foreground at base of dome) is being uplifted due to increase in activity. October 2, 2004.
South side of Mount St. Helens lava dome, glacier (cracked snowy surface in foreground at base of dome) is being uplifted due to increase in activity. October 2, 2004.

Criteria for estimation of the Volcanic Explosivity Index (VEI)
Criteria for estimation of the Volcanic Explosivity Index (VEI). Modified from: Newhall, C.G., and Self, S., 1982, The volcanic explosivity index (VEI): An estimate of explosive magnitude for historical volcanism. Journal of Geophysical Research, v. 87, no. C2, p.
Criteria for estimation of the Volcanic Explosivity Index (VEI). Modified from: Newhall, C.G., and Self, S., 1982, The volcanic explosivity index (VEI): An estimate of explosive magnitude for historical volcanism. Journal of Geophysical Research, v. 87, no. C2, p.

Geological map of Yellowstone National Park based on work by William Henry Holmes in 1878
Geological map of Yellowstone National Park based on work by William Henry Holmes in 1878 as part of Ferdinand Vandeveer Hayden’s United States Geological and Geographical Survey of the Territories, with topography mapped by Henry Gannett and triangulation by Allen David Wilson. From the Twelfth Annual Re
Geological map of Yellowstone National Park based on work by William Henry Holmes in 1878 as part of Ferdinand Vandeveer Hayden’s United States Geological and Geographical Survey of the Territories, with topography mapped by Henry Gannett and triangulation by Allen David Wilson. From the Twelfth Annual Re
Science and Products
Filter Total Items: 119
Yellowstone Volcano Observatory Monthly Update: July 1, 2019
Mike Poland, Scientist-in-Charge of the Yellowstone Volcano Observatory, describes activity at Yellowstone during the month of June, 2019.
Mike Poland, Scientist-in-Charge of the Yellowstone Volcano Observatory, describes activity at Yellowstone during the month of June, 2019.
Yellowstone Volcano Observatory Monthly Update: June 3, 2019
Mike Poland, Scientist-in-Charge of the Yellowstone Volcano Observatory, describes activity at Yellowstone during the month of May, 2019.
Mike Poland, Scientist-in-Charge of the Yellowstone Volcano Observatory, describes activity at Yellowstone during the month of May, 2019.
Deformation near South Sister from GPS data, 2001-2017
Horizontal displacements from campaign (black vectors) and continuous (red vectors, with station names given) GPS stations, as well as vertical displacements (indicated by color of GPS station symbol) near South Sister, Oregon. Length of arrow gives amount of horizontal displacement, with scale in lower left showing an arrow length
Horizontal displacements from campaign (black vectors) and continuous (red vectors, with station names given) GPS stations, as well as vertical displacements (indicated by color of GPS station symbol) near South Sister, Oregon. Length of arrow gives amount of horizontal displacement, with scale in lower left showing an arrow length
Time series of vertical displacements during April–October 2017 at four GPS stations on the north side of Yellowstone Lake
linkTime series of vertical displacements during April–October 2017 at four GPS stations (LAK1, LAK2, LKWY, and SEDG) on the north side of Yellowstone Lake. Downward trends indicate subsidence and upward trends show uplift. Uplift “spikes” in late September are related to inclement weather and do not show true deformation. Error bars are one standard deviation.
InSAR image Kīlauea, Hawai‘i, Mar. 2011 shows ground surface deflat...
InSAR image Kīlauea, Hawai‘i, Mar. 2011. Kamoamoa fissure trace is indicated by the red line.
InSAR image Kīlauea, Hawai‘i, Mar. 2011. Kamoamoa fissure trace is indicated by the red line.
Map of Kīlauea showing the south-SE motion, as recorded by continuo...
Map of Kīlauea Volcano showing the south-southeast motion, as recorded by continuous GPS sites (arrows), and earthquake epicenter between February 1-3, 2010.
Map of Kīlauea Volcano showing the south-southeast motion, as recorded by continuous GPS sites (arrows), and earthquake epicenter between February 1-3, 2010.
Lava Enters The Ocean At Kilauea Volcano, Hawai'i
Lava from the Pu'u 'Ō'ō-Kupaianaha eruption, active since 1983, enters the ocean on the south flank of Kīlauea Volcano.
Lava from the Pu'u 'Ō'ō-Kupaianaha eruption, active since 1983, enters the ocean on the south flank of Kīlauea Volcano.
An inquisitive Yellow-bellied Marmot stands on its hind legs, in Yellowstone National Park.
Yellow-bellied Marmot stands on its hind legs in Yellowstone National Park. Photo by D. Dzurisin.
Yellow-bellied Marmot stands on its hind legs in Yellowstone National Park. Photo by D. Dzurisin.
The USGS Hawaiian Volcano Observatory Monitors Kilauea's Summit Eruption
The USGS Hawaiian Volcano Observatory (foreground) is located on the caldera rim of Kilauea Volcano, Hawai'ithe most active volcano in the world. The observatory's location provides an excellent view of summit eruptive activity, which began in 2008.
The USGS Hawaiian Volcano Observatory (foreground) is located on the caldera rim of Kilauea Volcano, Hawai'ithe most active volcano in the world. The observatory's location provides an excellent view of summit eruptive activity, which began in 2008.
USGS Hawaiian Volcano Observatory Monitors Kilauea's Summit Eruption
The USGS Hawaiian Volcano Observatory (foreground) is located on the caldera rim of Kilauea Volcano, Hawai'i—the most active volcano in the world. The observatory's location provides an excellent view of summit eruptive activity, which began in 2008.
The USGS Hawaiian Volcano Observatory (foreground) is located on the caldera rim of Kilauea Volcano, Hawai'i—the most active volcano in the world. The observatory's location provides an excellent view of summit eruptive activity, which began in 2008.
Littoral Explosion At Kilauea Volcano, Hawai'i
When lava from the Pu'u 'Ō'ō-Kupaianaha eruption, active since 1983, meets the ocean, large littoral explosions can result.
When lava from the Pu'u 'Ō'ō-Kupaianaha eruption, active since 1983, meets the ocean, large littoral explosions can result.
South side of Mount St. Helens lava dome, glacier
South side of Mount St. Helens lava dome, glacier (cracked snowy surface in foreground at base of dome) is being uplifted due to increase in activity. October 2, 2004.
South side of Mount St. Helens lava dome, glacier (cracked snowy surface in foreground at base of dome) is being uplifted due to increase in activity. October 2, 2004.
Criteria for estimation of the Volcanic Explosivity Index (VEI)
Criteria for estimation of the Volcanic Explosivity Index (VEI). Modified from: Newhall, C.G., and Self, S., 1982, The volcanic explosivity index (VEI): An estimate of explosive magnitude for historical volcanism. Journal of Geophysical Research, v. 87, no. C2, p.
Criteria for estimation of the Volcanic Explosivity Index (VEI). Modified from: Newhall, C.G., and Self, S., 1982, The volcanic explosivity index (VEI): An estimate of explosive magnitude for historical volcanism. Journal of Geophysical Research, v. 87, no. C2, p.
Geological map of Yellowstone National Park based on work by William Henry Holmes in 1878
Geological map of Yellowstone National Park based on work by William Henry Holmes in 1878 as part of Ferdinand Vandeveer Hayden’s United States Geological and Geographical Survey of the Territories, with topography mapped by Henry Gannett and triangulation by Allen David Wilson. From the Twelfth Annual Re
Geological map of Yellowstone National Park based on work by William Henry Holmes in 1878 as part of Ferdinand Vandeveer Hayden’s United States Geological and Geographical Survey of the Territories, with topography mapped by Henry Gannett and triangulation by Allen David Wilson. From the Twelfth Annual Re
*Disclaimer: Listing outside positions with professional scientific organizations on this Staff Profile are for informational purposes only and do not constitute an endorsement of those professional scientific organizations or their activities by the USGS, Department of the Interior, or U.S. Government