
Cape Hatteras, N.C.
Images
Images intro.
Filter Total Items: 2135

Cape Hatteras, N.C.

Map of Fire Island, N.Y. study area
Map of Fire Island, N.Y. study area
Map of Fire Island, N.Y. study area

Study area map of Long Bay, S.C.
Map of Long Bay, S.C. study area

Study area map of coastal South Carolina
Study area map of coastal South Carolina
Study area map of coastal South Carolina

Oceanographic equipment recovery
Oceanographic equipment recovery

Acoustic backscatter and bathymetry maps

Map showing Holocene (modern) sediment thickness
Map showing Holocene (modern) sediment thickness in meters overlain on bathymetry. Regional bathymetric contours are in meters. Note the shoreface-attached sand ridges west of Watch Hill.
Map showing Holocene (modern) sediment thickness in meters overlain on bathymetry. Regional bathymetric contours are in meters. Note the shoreface-attached sand ridges west of Watch Hill.

Map showing the thickness of a relatively young Pleistocene outwash
Map showing the thickness of a relatively young Pleistocene outwash lobe in meters mapped using chirp seismic-reflection profiles collected in 2011, overlain on acoustic backscatter imagery. Regional bathymetric contours are in meters.
Map showing the thickness of a relatively young Pleistocene outwash lobe in meters mapped using chirp seismic-reflection profiles collected in 2011, overlain on acoustic backscatter imagery. Regional bathymetric contours are in meters.

Numerical model grids
Numerical model grids showing downscaling from larger regional grid (far right) to more refined coastal grid (left). Colors are bathymetry (m).
Numerical model grids showing downscaling from larger regional grid (far right) to more refined coastal grid (left). Colors are bathymetry (m).

Deployment period storm analysis.
Deployment period storm analysis. (A) significant wave height (red line) and wind speed and direction (arrows). Shading represents storm type (blue = cold front, red = warm front, yellow = low-pressure). (B) Vertical profiles of suspended-sediment concentration. (C) Cumulative along-shore and cross-shore sediment flux.
Deployment period storm analysis. (A) significant wave height (red line) and wind speed and direction (arrows). Shading represents storm type (blue = cold front, red = warm front, yellow = low-pressure). (B) Vertical profiles of suspended-sediment concentration. (C) Cumulative along-shore and cross-shore sediment flux.

Example of a rip current experiment.
Example of a rip current experiment. Colors show bathymetry and arrows show velocity vectors after 1 h of model simulation. Similar to results in Kumar and others, 2012.
Example of a rip current experiment. Colors show bathymetry and arrows show velocity vectors after 1 h of model simulation. Similar to results in Kumar and others, 2012.
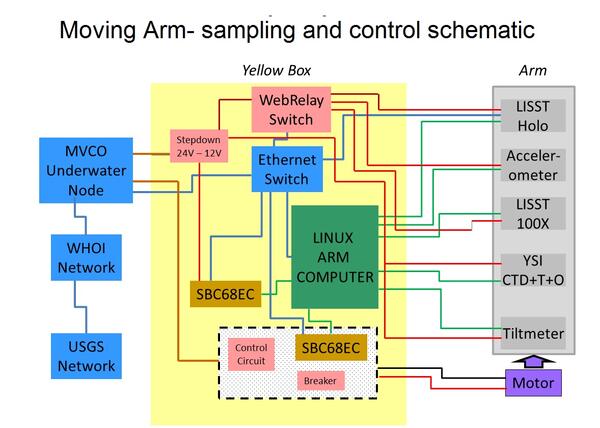
Schematic of system designed to control movement and logging of data
Schematic of system designed to control movement and logging of data collected by the Moving Arm Tripod at Martha's Vineyard Coastal Observatory in 2011.
Schematic of system designed to control movement and logging of data collected by the Moving Arm Tripod at Martha's Vineyard Coastal Observatory in 2011.

Bathymetry of the New England inner shelf and south shore of Martha’s
Bathymetry of the New England inner shelf and south shore of Martha’s Vineyard with model grids
Bathymetry of the New England inner shelf and south shore of Martha’s Vineyard with model grids

Oblique aerial photographs of Ocracoke Island, NC
Oblique aerial photographs of Ocracoke Island, NC, from May 6, 2008 (top, pre-storm) and August 30, 2011 (bottom, post-storm, acquired three days after landfall of Hurricane Irene). The yellow arrow in each image points to the same feature. Overwash deposits of sand extend over the road after the storm.
Oblique aerial photographs of Ocracoke Island, NC, from May 6, 2008 (top, pre-storm) and August 30, 2011 (bottom, post-storm, acquired three days after landfall of Hurricane Irene). The yellow arrow in each image points to the same feature. Overwash deposits of sand extend over the road after the storm.

Oblique aerial photographs of Hatteras Village, NC
Oblique aerial photographs of Hatteras Village, NC, from May 6, 2008 (top, pre-storm) and August 30, 2011(bottom, post-storm, acquired three days after landfall of Hurricane Irene). The yellow arrow in each image points to the same cottage.
Oblique aerial photographs of Hatteras Village, NC, from May 6, 2008 (top, pre-storm) and August 30, 2011(bottom, post-storm, acquired three days after landfall of Hurricane Irene). The yellow arrow in each image points to the same cottage.

Oblique aerial photograph from Rodanthe, NC, with enlarged details
Upper image: Oblique aerial photograph near Rodanthe, NC, looking south along the coast on August 30, 2011, three days after landfall of Hurricane Irene. Center: Oblique aerial photograph of central part of upper image from May 6, 2008, pre-storm; and August 31, 2011, post-storm. The yellow arrow in each image points to the same cottage.
Upper image: Oblique aerial photograph near Rodanthe, NC, looking south along the coast on August 30, 2011, three days after landfall of Hurricane Irene. Center: Oblique aerial photograph of central part of upper image from May 6, 2008, pre-storm; and August 31, 2011, post-storm. The yellow arrow in each image points to the same cottage.

Oblique aerial photograph from Pea Island, NC, with enlarged details
Upper image: Oblique aerial photograph of Pea Island National Wildlife Refuge, NC, looking north along the coast on August 30, 2011, three days after landfall of Hurricane Irene.
Upper image: Oblique aerial photograph of Pea Island National Wildlife Refuge, NC, looking north along the coast on August 30, 2011, three days after landfall of Hurricane Irene.

Worldwide distribution of observed and inferred gas hydrates
Worldwide distribution of observed and inferred gas hydrates in marine and permafrost-associated settings that have been the subject of drilling programs. The color coding refers to the primary sediment type in each location and therefore designates the likely type of gas hydrate reservoir at each site.
Worldwide distribution of observed and inferred gas hydrates in marine and permafrost-associated settings that have been the subject of drilling programs. The color coding refers to the primary sediment type in each location and therefore designates the likely type of gas hydrate reservoir at each site.


R/V Parke Snavely in Alviso Slough
USGS Pacific Coastal and Marine Science Center's research vessel R/V Parke Sanvely motors through Alviso Slough in the southern end of San Francisco Bay. Scientists were collecting depth data to make a detailed bathymetric map of the Bay.
USGS Pacific Coastal and Marine Science Center's research vessel R/V Parke Sanvely motors through Alviso Slough in the southern end of San Francisco Bay. Scientists were collecting depth data to make a detailed bathymetric map of the Bay.

Oceanographic equipment customized to reach the benthic boundary layer
Steaming to the deployment site south of Martha's Vineyard, MA in 2011. The platform shown was specially adapted so the arm cycles up and down through the Benthic Boubdary Layer while deployed on the seafloor. For more information see https://soundwaves.usgs.gov/2011/11/fieldwork2.html.
Steaming to the deployment site south of Martha's Vineyard, MA in 2011. The platform shown was specially adapted so the arm cycles up and down through the Benthic Boubdary Layer while deployed on the seafloor. For more information see https://soundwaves.usgs.gov/2011/11/fieldwork2.html.