
Left to Right: Trond Loke (Norsk Elektro Optikk), Isaac Anderson (USGS) and Liz Hyde (USGS) standing in front of the NASA ER-2 aircraft, during deployment to NASA Armstrong Flight Research Center, Palmdale, CA.
Images
The National Land Imaging Program supports a variety of geospatial data programs and projects, including the USGS Landsat Program. Browse the images below to see some of the imagery produced using NLI-supported data sources.
Filter Total Items: 401

USGS and partner engineers with the NASA ER-2 aircraft
Left to Right: Trond Loke (Norsk Elektro Optikk), Isaac Anderson (USGS) and Liz Hyde (USGS) standing in front of the NASA ER-2 aircraft, during deployment to NASA Armstrong Flight Research Center, Palmdale, CA.

First natural color image from the high-altitude HySpex hyperspectral imaging sensor
Natural color image from the first flight of the high-altitude HySpex V-1240. Image is oriented with respect to true North, and is centered around Colombia, CA.
Natural color image from the first flight of the high-altitude HySpex V-1240. Image is oriented with respect to true North, and is centered around Colombia, CA.

Collection 1 Datasets To Be Removed by End of 2022
By the end of December 2022, all Landsat Collection 1 data and science products will be removed from USGS data access platforms. This depreciation includes Level-1, Level-2, Level-3, and ESPA- related products. Collection 1 has not been updated with Landsat products since December 31, 2021.
By the end of December 2022, all Landsat Collection 1 data and science products will be removed from USGS data access platforms. This depreciation includes Level-1, Level-2, Level-3, and ESPA- related products. Collection 1 has not been updated with Landsat products since December 31, 2021.

HySpex hyperspectral imaging sensor
High-altitude version of the HySpex Mjolnir V-1240 hyperspectral imaging sensor installed in the nose of the ER-2. This assembly is specially focused for high-altitude imagery and has a lightweight housing design for use on High Altitude Long Endurance UAS.
High-altitude version of the HySpex Mjolnir V-1240 hyperspectral imaging sensor installed in the nose of the ER-2. This assembly is specially focused for high-altitude imagery and has a lightweight housing design for use on High Altitude Long Endurance UAS.
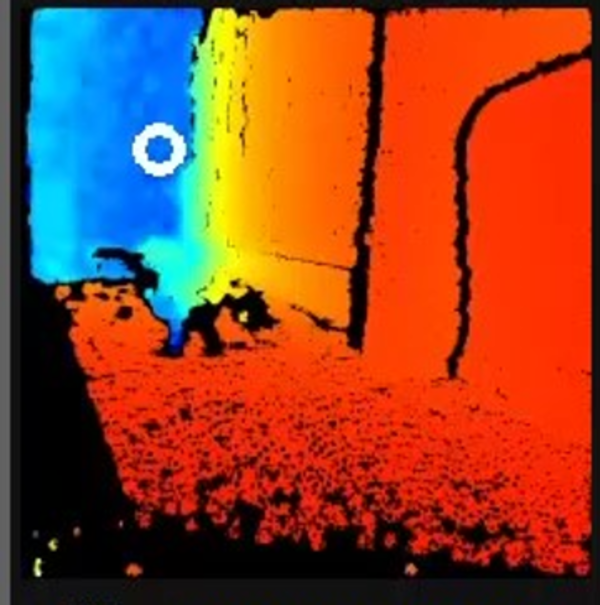
BisonCore Collision Avoidance/GPS Denied Navigation operating in hallway
USGS National Innovation Center UAS Research Center's BisonCore Project, augments an autonomous rover to navigate around obstacles through a hallway, in a GPS Denied Environment. Augmentation done through payload directed operations on data from stereo depth sensors. White circle depicts vehicle’s desired direction.
USGS National Innovation Center UAS Research Center's BisonCore Project, augments an autonomous rover to navigate around obstacles through a hallway, in a GPS Denied Environment. Augmentation done through payload directed operations on data from stereo depth sensors. White circle depicts vehicle’s desired direction.

Dynamic surface water maps of Canada from 1984 to 2019 Landsat satellite imagery
This paper presents dynamic surface water products over Canada from the first in a series of satellite sensors that will be used to develop a multi-sensor dynamic surface water monitoring system. The dataset uses 1984 to 2019 Landsat data to create annual water masks, inundation frequency and wetting/drying trends.
This paper presents dynamic surface water products over Canada from the first in a series of satellite sensors that will be used to develop a multi-sensor dynamic surface water monitoring system. The dataset uses 1984 to 2019 Landsat data to create annual water masks, inundation frequency and wetting/drying trends.

Landsat Level-1 Scenes Available from EarthExplorer
This graphic shows the number of Landsat Level-1 scenes available for download from EarthExplorer.
View more statistics on the Landsat Project Statistics page.
This graphic shows the number of Landsat Level-1 scenes available for download from EarthExplorer.
View more statistics on the Landsat Project Statistics page.

Landsat Level-2 Scenes Available on Earth Explorer
This graphic displays the number of Landsat Level-2 scenes available on Earth Explorer.
View more statistics on the Landsat Project Statistics page.
This graphic displays the number of Landsat Level-2 scenes available on Earth Explorer.
View more statistics on the Landsat Project Statistics page.

Primary Uses of Landsat Data
In 2008 Landsat data became accessible to all users at no cost. This graphic displays the primary uses of Landsat data.
View more statistics on the Landsat Project Statistics page.
In 2008 Landsat data became accessible to all users at no cost. This graphic displays the primary uses of Landsat data.
View more statistics on the Landsat Project Statistics page.

Landsat Level-1 Cumulative Downloads
This graphic displays the millions of Landsat Level-1 downloads, from 2008 to present.
View more statistics on the Landsat Project Statistics page.
This graphic displays the millions of Landsat Level-1 downloads, from 2008 to present.
View more statistics on the Landsat Project Statistics page.

Special Issue: Landsat Update 50th Anniversary
Landsat Updates are prepared periodically and distributed electronically to provide information about Landsat activities and related topics of interest. Read this issue here.
Landsat Updates are prepared periodically and distributed electronically to provide information about Landsat activities and related topics of interest. Read this issue here.

Landsat 9 image over Svalbard, Norway
Landsat 9 image over Svalbard, Norway. Acquired on July 8, 2022, Path 26 Row 240. For more information on Landsat data, visit the Landsat Mission Website.
Landsat 9 image over Svalbard, Norway. Acquired on July 8, 2022, Path 26 Row 240. For more information on Landsat data, visit the Landsat Mission Website.

Landsat 8 Image of Washburn Fire, Yosemite National Park - July 7, 2022
The Landsat 8 thermal image of the Washburn fire was acquired at night to pinpoint the location (bright white) of heat from the fire as it began. Firefighters immediately focused on suppressing the wildfire to minimize any effects on the Mariposa Grove of Giant Sequoias. As of July 18, 2022, the fire covered nearly 5,000 acres.
The Landsat 8 thermal image of the Washburn fire was acquired at night to pinpoint the location (bright white) of heat from the fire as it began. Firefighters immediately focused on suppressing the wildfire to minimize any effects on the Mariposa Grove of Giant Sequoias. As of July 18, 2022, the fire covered nearly 5,000 acres.

Landsat 9 Image of Washburn Fire, Yosemite National Park - July 7, 2022
The Washburn Fire started July 7, 2022 in the southern part of Yosemite National Park. Landsats 8 and 9 both captured imagery of it a day later. The Landsat 9 image uses shortwave infrared and near-infrared bands to show the active burning.
The Washburn Fire started July 7, 2022 in the southern part of Yosemite National Park. Landsats 8 and 9 both captured imagery of it a day later. The Landsat 9 image uses shortwave infrared and near-infrared bands to show the active burning.

Landsat Looks At The Moon
Two Earth-observing satellites turned to watch a lunar eclipse, revealing dramatic and uneven temperature changes across our closest celestial neighbor.
NASA Earth Image of the Day for July 5, 2022
Instruments:
Landsat 8 — TIRS
Landsat 9 — TIRS-2
Photograph
Two Earth-observing satellites turned to watch a lunar eclipse, revealing dramatic and uneven temperature changes across our closest celestial neighbor.
NASA Earth Image of the Day for July 5, 2022
Instruments:
Landsat 8 — TIRS
Landsat 9 — TIRS-2
Photograph

Brightness Temperature v. Time chart for TIRS
Over the course of the four-hour eclipse, the TIRS sensors observed the intensity of infrared light radiating from the Moon’s surface. From those radiances, scientists calculated the temperatures required to generate them. This “brightness temperature” of the lunar surface changed as Earth’s shadow marched across the lunar landscape.
Over the course of the four-hour eclipse, the TIRS sensors observed the intensity of infrared light radiating from the Moon’s surface. From those radiances, scientists calculated the temperatures required to generate them. This “brightness temperature” of the lunar surface changed as Earth’s shadow marched across the lunar landscape.

Mapping of Flood Areas Using Landsat with Google Earth Engine Cloud Platform
Using Google Earth Engine and Landsat, this team created a rapid and robust tool for mapping historical flood inundation areas. This enhances existing efforts towards flood mitigation, monitoring, and management.
Using Google Earth Engine and Landsat, this team created a rapid and robust tool for mapping historical flood inundation areas. This enhances existing efforts towards flood mitigation, monitoring, and management.

First Experiences with the Collection 1 Landsat 8 Aquatic Reflectance Product

Landsat 9 image over Norway
Landsat 9 image acquired on June 27, 2022 (Path 198 Row 11) over Norway. For more information on Landsat data, visit the Landsat Mission Website.
Landsat 9 image acquired on June 27, 2022 (Path 198 Row 11) over Norway. For more information on Landsat data, visit the Landsat Mission Website.

Landsat Collections Screenshot
This screenshot shows what the Landsat Collections interactive looks like. This storymap collection combines all of the individual satellite storymaps into one location.
This screenshot shows what the Landsat Collections interactive looks like. This storymap collection combines all of the individual satellite storymaps into one location.

Landsat 9 First Light Images
Landsat 9 launched into space on September 27th, 2021. The "first light" images arrived on October 31st. On that day the satellite captured: algal blooms in Lake Erie, the glaciers of the Himalayas, bush fires in Australia's Eucalypt Woodlands, coastal communities on the Florida panhandle, and deserts, mountains and mesas across the Navajo Nation.
Landsat 9 launched into space on September 27th, 2021. The "first light" images arrived on October 31st. On that day the satellite captured: algal blooms in Lake Erie, the glaciers of the Himalayas, bush fires in Australia's Eucalypt Woodlands, coastal communities on the Florida panhandle, and deserts, mountains and mesas across the Navajo Nation.