
Photograph showing a bedrock outcrop near the intersection of Post Road and Daniel Webster Highway (New Hampshire State Route 3) in Hooksett, New Hampshire. During the summer, groundwater stains the exposed bedrock with precipitated iron oxides.
Images
Images
Filter Total Items: 1910

Bedrock outcrop in New Hampshire
Photograph showing a bedrock outcrop near the intersection of Post Road and Daniel Webster Highway (New Hampshire State Route 3) in Hooksett, New Hampshire. During the summer, groundwater stains the exposed bedrock with precipitated iron oxides.

The Concept of Geologic Carbon Sequestration
The use of carbon dioxide (CO2) injection for enhanced oil recovery (EOR) can prolong the productivity of many oil reservoirs and increase the U.S. hydrocarbon recoverable resource volume.
The use of carbon dioxide (CO2) injection for enhanced oil recovery (EOR) can prolong the productivity of many oil reservoirs and increase the U.S. hydrocarbon recoverable resource volume.

Backscatter intensity on Stellwagen Bank
Map C. Backscatter intensity and sun-illuminated topography. Blue= "soft" seabed, Green, orange = "hard" seabed
Map C. Backscatter intensity and sun-illuminated topography. Blue= "soft" seabed, Green, orange = "hard" seabed

Stellwagen Bank project research sites in the United States and Canada
Stellwagen Bank project research areas in the United States and Canada
Stellwagen Bank project research areas in the United States and Canada

Cape Hatteras, N.C.
Cape Hatteras, N.C.

Map of Fire Island, N.Y. study area
Map of Fire Island, N.Y. study area
Map of Fire Island, N.Y. study area

Study area map of Long Bay, S.C.
Map of Long Bay, S.C. study area

Study area map of coastal South Carolina
Study area map of coastal South Carolina
Study area map of coastal South Carolina

Oceanographic equipment recovery
Oceanographic equipment recovery

Acoustic backscatter and bathymetry maps

Map showing Holocene (modern) sediment thickness
Map showing Holocene (modern) sediment thickness in meters overlain on bathymetry. Regional bathymetric contours are in meters. Note the shoreface-attached sand ridges west of Watch Hill.
Map showing Holocene (modern) sediment thickness in meters overlain on bathymetry. Regional bathymetric contours are in meters. Note the shoreface-attached sand ridges west of Watch Hill.

Map showing the thickness of a relatively young Pleistocene outwash
Map showing the thickness of a relatively young Pleistocene outwash lobe in meters mapped using chirp seismic-reflection profiles collected in 2011, overlain on acoustic backscatter imagery. Regional bathymetric contours are in meters.
Map showing the thickness of a relatively young Pleistocene outwash lobe in meters mapped using chirp seismic-reflection profiles collected in 2011, overlain on acoustic backscatter imagery. Regional bathymetric contours are in meters.

Numerical model grids
Numerical model grids showing downscaling from larger regional grid (far right) to more refined coastal grid (left). Colors are bathymetry (m).
Numerical model grids showing downscaling from larger regional grid (far right) to more refined coastal grid (left). Colors are bathymetry (m).

Deployment period storm analysis.
Deployment period storm analysis. (A) significant wave height (red line) and wind speed and direction (arrows). Shading represents storm type (blue = cold front, red = warm front, yellow = low-pressure). (B) Vertical profiles of suspended-sediment concentration. (C) Cumulative along-shore and cross-shore sediment flux.
Deployment period storm analysis. (A) significant wave height (red line) and wind speed and direction (arrows). Shading represents storm type (blue = cold front, red = warm front, yellow = low-pressure). (B) Vertical profiles of suspended-sediment concentration. (C) Cumulative along-shore and cross-shore sediment flux.

Example of a rip current experiment.
Example of a rip current experiment. Colors show bathymetry and arrows show velocity vectors after 1 h of model simulation. Similar to results in Kumar and others, 2012.
Example of a rip current experiment. Colors show bathymetry and arrows show velocity vectors after 1 h of model simulation. Similar to results in Kumar and others, 2012.
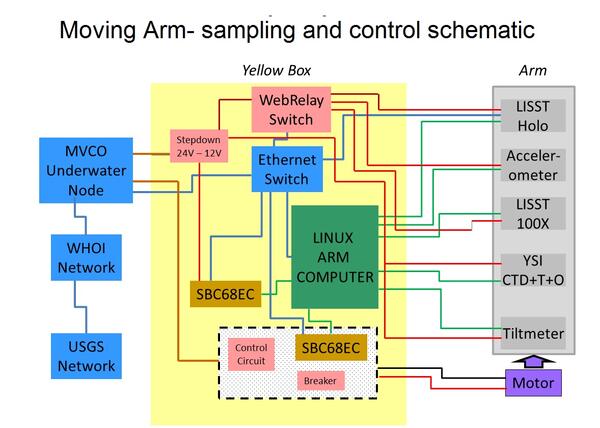
Schematic of system designed to control movement and logging of data
Schematic of system designed to control movement and logging of data collected by the Moving Arm Tripod at Martha's Vineyard Coastal Observatory in 2011.
Schematic of system designed to control movement and logging of data collected by the Moving Arm Tripod at Martha's Vineyard Coastal Observatory in 2011.

Bathymetry of the New England inner shelf and south shore of Martha’s
Bathymetry of the New England inner shelf and south shore of Martha’s Vineyard with model grids
Bathymetry of the New England inner shelf and south shore of Martha’s Vineyard with model grids

Worldwide distribution of observed and inferred gas hydrates
Worldwide distribution of observed and inferred gas hydrates in marine and permafrost-associated settings that have been the subject of drilling programs. The color coding refers to the primary sediment type in each location and therefore designates the likely type of gas hydrate reservoir at each site.
Worldwide distribution of observed and inferred gas hydrates in marine and permafrost-associated settings that have been the subject of drilling programs. The color coding refers to the primary sediment type in each location and therefore designates the likely type of gas hydrate reservoir at each site.

Outer Banks in South Carolina, November 2011
Picture of the Outer Banks in South Carolina, November 2011
Picture of the Outer Banks in South Carolina, November 2011

Outer Banks in South Carolina, November 2011
Picture of the Outer Banks in South Carolina, November 2011.
Picture of the Outer Banks in South Carolina, November 2011.

Outer Banks in South Carolina, November 2011
The sun begins to set through the trees within the Outer Banks, South Carolina (November 2011).
The sun begins to set through the trees within the Outer Banks, South Carolina (November 2011).