
Snapshot of QFaults for the area including Yellowstone National Park from https://www.usgs.gov/programs/earthquake-hazards/faults
Images
Earthquake Hazards Program images.
Filter Total Items: 554
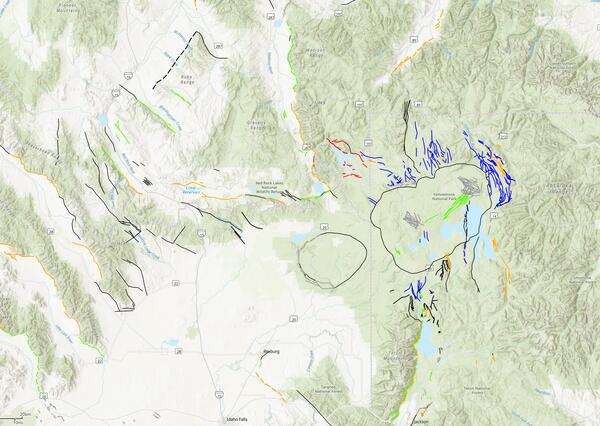
Snapshot of QFaults for the area including Yellowstone National Park
Snapshot of QFaults for the area including Yellowstone National Park from https://www.usgs.gov/programs/earthquake-hazards/faults

Seismic hazard model for Hawaii from 2021 showing peak ground acceleration where warmer colors are higher levels.
linkSeismic hazard model for Hawaii from 2021 showing peak ground acceleration where warmer colors are higher levels (Petersen and others, 2022).
Seismic hazard model for Hawaii from 2021 showing peak ground acceleration where warmer colors are higher levels.
linkSeismic hazard model for Hawaii from 2021 showing peak ground acceleration where warmer colors are higher levels (Petersen and others, 2022).

Alaska cross section from the 2023 NSHM
A cross section through the area of Anchorage, AK showing earthquakes at depths along with subduction model linework from Slab2 and inputs from the 2007 NSHM. The image shows the seismic catalog (for the 2023 NSHM seismic hazard model for Alaska; Powers and others, 2024) for the crust (yellow), interface (orange), and intraslab (red).
A cross section through the area of Anchorage, AK showing earthquakes at depths along with subduction model linework from Slab2 and inputs from the 2007 NSHM. The image shows the seismic catalog (for the 2023 NSHM seismic hazard model for Alaska; Powers and others, 2024) for the crust (yellow), interface (orange), and intraslab (red).
AftershockForecastSequence-SpecificModelParameters.png
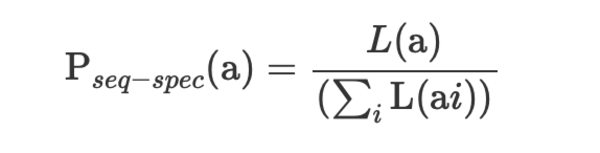
Aftershock Forecast Sequence-Specific Model Parameters equation
The probability distribution for the number of aftershocks, P(N), and the forecast can then be computed using the same procedures as for the generic model, using Pseq-spec(a) instead of Pgeneric(a).
Aftershock Forecast Sequence-Specific Model Parameters equation
The probability distribution for the number of aftershocks, P(N), and the forecast can then be computed using the same procedures as for the generic model, using Pseq-spec(a) instead of Pgeneric(a).

AftershockForecastfig6.gif
An example of Bayesian updating of productivity parameter (a-value) for the 2010 Mw 8.8 Maule, Chile, earthquake. Immediately following the earthquake, the SZ-GENERIC region-specific a-value distribution can be used.
An example of Bayesian updating of productivity parameter (a-value) for the 2010 Mw 8.8 Maule, Chile, earthquake. Immediately following the earthquake, the SZ-GENERIC region-specific a-value distribution can be used.

Mendocino_headerinfo-2.jpg
Screenshot of the Aftershock Forecast for an earthquake in California, showing the information box at the top of the forecast and the four tabs of forecast information.
Screenshot of the Aftershock Forecast for an earthquake in California, showing the information box at the top of the forecast and the four tabs of forecast information.

AftershockEquation2Screenshot.png
Equation 2 for the Aftershock Forecast probability distribution to compute the forecast
Equation 2 for the Aftershock Forecast probability distribution to compute the forecast

ShakeMap icon
Icon used to refer to ShakeMap on Product landing pages. For example use, see https://staging-earthquake.usgs.gov/data/pager/background.php.
Icon used to refer to ShakeMap on Product landing pages. For example use, see https://staging-earthquake.usgs.gov/data/pager/background.php.

fig4.gif
Two example aftershock sequences, from southern California, that illustrate the three general rules of aftershocks. A circle shows each aftershock's time of occurrence (horizontal axis) and magnitude (vertical axis). The larger-magnitude M6.7 Northridge earthquake is followed by many more aftershocks than the smaller M5.1 La Habra earthquake.
Two example aftershock sequences, from southern California, that illustrate the three general rules of aftershocks. A circle shows each aftershock's time of occurrence (horizontal axis) and magnitude (vertical axis). The larger-magnitude M6.7 Northridge earthquake is followed by many more aftershocks than the smaller M5.1 La Habra earthquake.

Mendocino_M4all.jpg
Screenshot of the Aftershock Forecast for an earthquake in California, with the “Summary” tab selected, and “M4+” and “Show All” selections for magnitude and forecast duration.
Screenshot of the Aftershock Forecast for an earthquake in California, with the “Summary” tab selected, and “M4+” and “Show All” selections for magnitude and forecast duration.

Mendocino_M41month.jpg
Screenshot of the Aftershock Forecast for an earthquake in California, with the “Summary” tab selected, and “M4+” and “Show All” selections for magnitude and forecast duration.
Screenshot of the Aftershock Forecast for an earthquake in California, with the “Summary” tab selected, and “M4+” and “Show All” selections for magnitude and forecast duration.

Mendocino_map copy.jpg
Screenshot of the Aftershock Forecast for an earthquake in California, with the “Summary” tab selected, scrolled to the bottom of the page. The mainshock is shown with a yellow star on top of its circle; other earthquakes in the forecasting region are also shown colored by time of occurrence.
Screenshot of the Aftershock Forecast for an earthquake in California, with the “Summary” tab selected, scrolled to the bottom of the page. The mainshock is shown with a yellow star on top of its circle; other earthquakes in the forecasting region are also shown colored by time of occurrence.

Mendocino_parameters.jpg
Aftershock Forecast Model parameters screenshot of the Aftershock Forecast Overview page
Aftershock Forecast Model parameters screenshot of the Aftershock Forecast Overview page

Mendocino_table.jpg
Screenshot of the Aftershock Forecast for an earthquake in California, with the “Forecast Table” tab selected.
Screenshot of the Aftershock Forecast for an earthquake in California, with the “Forecast Table” tab selected.

Mendocino_table.jpg - Copy
Screenshot of the Aftershock Forecast for an earthquake in California, with the “Commentary” tab selected.
Screenshot of the Aftershock Forecast for an earthquake in California, with the “Commentary” tab selected.

Aftershock Forecast on the earthquake event page
Screenshot of the Overview webpage for an earthquake in California. The “Aftershock Forecast” card is at lower center.
Screenshot of the Overview webpage for an earthquake in California. The “Aftershock Forecast” card is at lower center.

Aftershock Forecast for an earthquake in California
Screenshot of the Aftershock Forecast for an earthquake in California, with the “Summary” tab selected, and “Show All” and “1 Month” selections for magnitude and forecast duration.
Screenshot of the Aftershock Forecast for an earthquake in California, with the “Summary” tab selected, and “Show All” and “1 Month” selections for magnitude and forecast duration.

Seismographs at the Albuquerque Seismological Laboratory
(a) Photograph of instruments being tested in the East portion of the underground vault. (b) Wench and location of three boreholes in the West portion of the underground vault. (c) Cross-tunnel and recording equipment for the reference sensor vault.
(a) Photograph of instruments being tested in the East portion of the underground vault. (b) Wench and location of three boreholes in the West portion of the underground vault. (c) Cross-tunnel and recording equipment for the reference sensor vault.
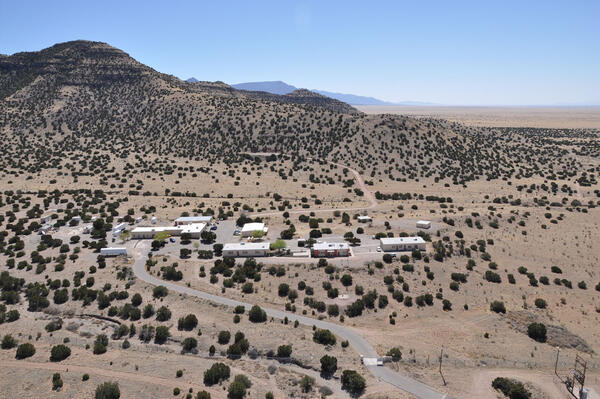
Aerial View of the Albuquerque Seismological Laboratory
Arial view from the North of the Albuquerque Seismological Laboratory on the Kirtland Air Force Base about 15 miles southeast of Albuquerque, New Mexico.
Arial view from the North of the Albuquerque Seismological Laboratory on the Kirtland Air Force Base about 15 miles southeast of Albuquerque, New Mexico.

Global Seismographic Network (GSN) Stations
Locations of the Global Seismographic Network (GSN) stations. USGS GSN sites are shown as pink circles and IRIS/IDA stations are shown as green circles. (as of October 2024)
Locations of the Global Seismographic Network (GSN) stations. USGS GSN sites are shown as pink circles and IRIS/IDA stations are shown as green circles. (as of October 2024)

Cover of fictional Great ShakeOut instruction manual.
[Cover]
Did you feel that? The annual Great ShakeOut Earthquake Drill is coming on Thursday, Oct. 17, 2024, at 10:17 a.m. (local time, wherever you are). We never know where or when an earthquake may happen, but preparing is easier than assembling a piece of Scandinavian furniture.
[Cover]
Did you feel that? The annual Great ShakeOut Earthquake Drill is coming on Thursday, Oct. 17, 2024, at 10:17 a.m. (local time, wherever you are). We never know where or when an earthquake may happen, but preparing is easier than assembling a piece of Scandinavian furniture.