
Scientists from the USGS Pacific Coastal and Marine Science Center in their vessel jewell, docked at Belden's Landing Water Access Facility on Montezuma Slough. They are preparing for a day of sampling on Grizzly Bay, where they study how sediment moves through sensitive coastal environments.
Images
Images intro.
Filter Total Items: 1196

Preparing for a day of sampling on Grizzly Bay
Scientists from the USGS Pacific Coastal and Marine Science Center in their vessel jewell, docked at Belden's Landing Water Access Facility on Montezuma Slough. They are preparing for a day of sampling on Grizzly Bay, where they study how sediment moves through sensitive coastal environments.

Preparing the GOMEX on Grizzly Bay
From left to right, USGS scientists Sam McGill, Lucas WinklerPrins, David Hart, Selina Davila Olivera, and Pete Dal Ferro work on Grizzly Bay on the vessel Jewell, to collect sediment samples using the GOMEX box corer.
From left to right, USGS scientists Sam McGill, Lucas WinklerPrins, David Hart, Selina Davila Olivera, and Pete Dal Ferro work on Grizzly Bay on the vessel Jewell, to collect sediment samples using the GOMEX box corer.

Sediment collected in a GOMEX box corer
USGS science crew works to free the muddy sediment from a GOMEX box corer. They are on board the Pacific Coastal and Marine Science Center's vessel Jewell on Grizzly Bay in the San Francisco Bay area.
USGS science crew works to free the muddy sediment from a GOMEX box corer. They are on board the Pacific Coastal and Marine Science Center's vessel Jewell on Grizzly Bay in the San Francisco Bay area.
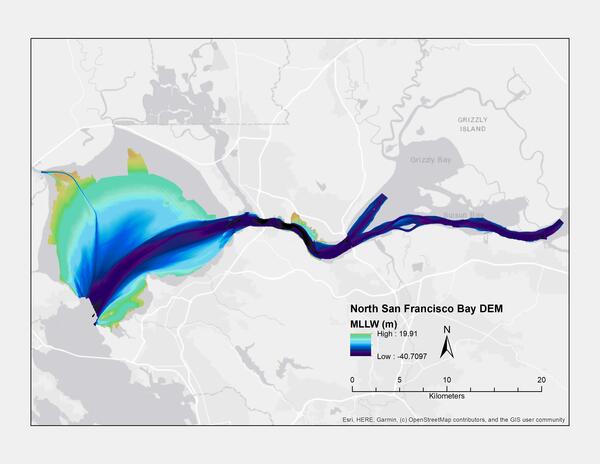
Bathymetric map of the northern portion of San Francisco Bay (MLLW)
Digital elevation model (DEM) of northern San Francisco Bay, California, created using bathymetry data collected between 1999 and 2016 (MLLW)
Digital elevation model (DEM) of northern San Francisco Bay, California, created using bathymetry data collected between 1999 and 2016 (MLLW)

California coastline
The U.S. west coast is an area of complex coastal geography. This photograph depicts several examples of geological features along the California coastline that are shaped by varied coastal processes. The gently sloping beach, stark bluffs, and presence of smooth rocks suggests that the coastal processes shaping this coastline are complex.
The U.S. west coast is an area of complex coastal geography. This photograph depicts several examples of geological features along the California coastline that are shaped by varied coastal processes. The gently sloping beach, stark bluffs, and presence of smooth rocks suggests that the coastal processes shaping this coastline are complex.

California coastal erosion
This region of the California coastline is lined with coastal bluffs that have been shaped not only by runoff from rain, but also by wave- and wind-driven erosion. This photo from Pescadero State Beach displays an example of a bluff undergoing erosional processes. Water from the ocean, delivered in waves, can overtop some of these coastal bluffs.
This region of the California coastline is lined with coastal bluffs that have been shaped not only by runoff from rain, but also by wave- and wind-driven erosion. This photo from Pescadero State Beach displays an example of a bluff undergoing erosional processes. Water from the ocean, delivered in waves, can overtop some of these coastal bluffs.

Coastal storm modeling system integrates economic impacts
Patrick Barnard explains how the Coastal Storm Modeling System (CoSMoS) integrates information from the Hazards Exposure Reporting and Analytics (HERA) mapper to understand the social and economic consequences of different flooding scenarios.
Patrick Barnard explains how the Coastal Storm Modeling System (CoSMoS) integrates information from the Hazards Exposure Reporting and Analytics (HERA) mapper to understand the social and economic consequences of different flooding scenarios.

Florida Coral Reefs and Coastal Hazard Risk Reduction
Rigorously Valuing the Role of Florida’s Coral Reefs in Coastal Hazard Risk Reduction
Estimated Annual Benefits
Rigorously Valuing the Role of Florida’s Coral Reefs in Coastal Hazard Risk Reduction
Estimated Annual Benefits

American Samoa Coral Reefs and Coastal Hazard Risk Reduction
Rigorously Valuing the Role of American Samoa’s Coral Reefs in Coastal Hazard Risk Reduction
Estimated Annual Benefits
Rigorously Valuing the Role of American Samoa’s Coral Reefs in Coastal Hazard Risk Reduction
Estimated Annual Benefits

Guam and CNMI Coral Reefs and Coastal Hazard Risk Reduction
Rigorously Valuing the Role of Guam’s Coral Reefs and the Commonwealth of the Northern Mariana Islands’s Coral Reefs in Coastal Hazard Risk Reduction
Estimated Annual Benefits
Rigorously Valuing the Role of Guam’s Coral Reefs and the Commonwealth of the Northern Mariana Islands’s Coral Reefs in Coastal Hazard Risk Reduction
Estimated Annual Benefits

Economic benefit of coral reef-lined coastlines in U.S.
Map displaying the distribution of total economic losses (direct building damages and indirect economic disruption) in the U.S. that are prevented from flooding by coral reefs annually. In total, the annual coastal flooding risk reduction benefits provided by U.S. coral reefs exceed $1.8 billion.
Map displaying the distribution of total economic losses (direct building damages and indirect economic disruption) in the U.S. that are prevented from flooding by coral reefs annually. In total, the annual coastal flooding risk reduction benefits provided by U.S. coral reefs exceed $1.8 billion.

Hawaiʻi Coral Reefs and Coastal Hazard Risk Reduction
Rigorously Valuing the Role of Hawaiʻi’s Coral Reefs in Coastal Hazard Risk Reduction
Estimated Annual Benefits
Rigorously Valuing the Role of Hawaiʻi’s Coral Reefs in Coastal Hazard Risk Reduction
Estimated Annual Benefits

U.S. Virgin Islands Coral Reefs and Coastal Hazard Risk Reduction
Rigorously Valuing the Role of the U.S. Virgin Islands’ Coral Reefs in Coastal Hazard Risk Reduction
Estimated Annual Benefits
Rigorously Valuing the Role of the U.S. Virgin Islands’ Coral Reefs in Coastal Hazard Risk Reduction
Estimated Annual Benefits

Puerto Rico Coral Reefs and Coastal Hazard Risk Reduction
Rigorously Valuing the Role of Puerto Rico’s Coral Reefs in Coastal Hazard Risk Reduction
Estimated Annual Benefits
Rigorously Valuing the Role of Puerto Rico’s Coral Reefs in Coastal Hazard Risk Reduction
Estimated Annual Benefits

Field work in the Columbia River Littoral Cell
Photographs showing equipment used during bathymetric and topographic surveys along the Columbia River littoral cell, Washington and Oregon.
Photographs showing equipment used during bathymetric and topographic surveys along the Columbia River littoral cell, Washington and Oregon.

squid-5StudyAreaMap.jpg
Image map of study area showing (a) study region, (b) study sites, (c, d) example orthomosaic images, and (e) photo of SET 1.
Image map of study area showing (a) study region, (b) study sites, (c, d) example orthomosaic images, and (e) photo of SET 1.

Astoria Canyon multibeam bathymetry
Multibeam bathymetry shown in the spectrum from red (shallower) to blue (deeper) for depths greater than 200 m across the head of Astoria Canyon. The land and continental shelf are shown in grayscale slope shading where darker colors represent steeper slopes. The modern Columbia River is far right.
Multibeam bathymetry shown in the spectrum from red (shallower) to blue (deeper) for depths greater than 200 m across the head of Astoria Canyon. The land and continental shelf are shown in grayscale slope shading where darker colors represent steeper slopes. The modern Columbia River is far right.

Southern Cascadia topography and bathymetry
Topography and bathymetry of southern Cascadia, which includes southern Oregon and northern California (seafloor depths between 200 and 3000 m are shown in the spectrum color scale from red (shallower) to purple (deeper). The land and continental shelf are shown in grayscale slope shading where darker colors represent steeper slopes.
Topography and bathymetry of southern Cascadia, which includes southern Oregon and northern California (seafloor depths between 200 and 3000 m are shown in the spectrum color scale from red (shallower) to purple (deeper). The land and continental shelf are shown in grayscale slope shading where darker colors represent steeper slopes.

Evolution of shoreline around Elwha River mouth
Evolution of the shoreline around the Elwha River mouth, Washington, before, during and after dam removal, 2011–2017. Two large dams were removed from the Elwha River between 2011 and 2014 in the largest dam removal worldwide thus far, releasing more than 20 million tons of sediment downstream.
Evolution of the shoreline around the Elwha River mouth, Washington, before, during and after dam removal, 2011–2017. Two large dams were removed from the Elwha River between 2011 and 2014 in the largest dam removal worldwide thus far, releasing more than 20 million tons of sediment downstream.

Retrieving a core sampler
USGS scientists Dan Powers (left) and Andy Ritchie retrieving a core sample from beneath Lake Ozette aboard research vessel Hadai.
USGS scientists Dan Powers (left) and Andy Ritchie retrieving a core sample from beneath Lake Ozette aboard research vessel Hadai.

Lake Ozette bathymetry
Bathymetric map of Lake Ozette, showing locations of core samples (red circles).
Bathymetric map of Lake Ozette, showing locations of core samples (red circles).