
Rockaway Beach, New York is heavily developed, has seawalls and groins and is regularly nourished. It hasn’t changed much over 20 years. The shoreface is steep and sediment cover doesn’t extend far from shore—likely the result of being fixed in place for decades. USGS scientists collect geologic and morphologic data from this island’s shoreface.
Images
Images intro.
Filter Total Items: 672

Rockaway Beach, New York 1994 - 2014
Rockaway Beach, New York is heavily developed, has seawalls and groins and is regularly nourished. It hasn’t changed much over 20 years. The shoreface is steep and sediment cover doesn’t extend far from shore—likely the result of being fixed in place for decades. USGS scientists collect geologic and morphologic data from this island’s shoreface.

Modeled beach profile evolution at Parramore Island, Virginia
Animation displays modeled beach profile elevation as it has evolved at Parramore Island, Virginia. These data are based on geomorphic investigation and measure distance (in kilometers) of cross-shore accretion. QS is the flux of sand to the beach, and QD is the flux of sand from the beach to the active dune.
Animation displays modeled beach profile elevation as it has evolved at Parramore Island, Virginia. These data are based on geomorphic investigation and measure distance (in kilometers) of cross-shore accretion. QS is the flux of sand to the beach, and QD is the flux of sand from the beach to the active dune.

Modeled beach profile evolution at Fishing Point, Virginia
Animation displays modeled beach profile elevation as it has evolved at Fishing Point, Virginia. These data are based on historical charts and images and measure distance (in kilometers) of cross-shore accretion. QS is the flux of sand to the beach, and QD is the flux of sand from the beach to the active dune.
Animation displays modeled beach profile elevation as it has evolved at Fishing Point, Virginia. These data are based on historical charts and images and measure distance (in kilometers) of cross-shore accretion. QS is the flux of sand to the beach, and QD is the flux of sand from the beach to the active dune.

SPCMSC Library
Rows of scientific journal articles housed within the library at the USGS St. Petersburg Coastal and Marine Science Center.
Rows of scientific journal articles housed within the library at the USGS St. Petersburg Coastal and Marine Science Center.

Lesson plan key for identifying coral condition
Key used in an educational lesson plan for identifying the composition and condition of corals and coralline algae in a core. (a) Two examples of Pocillopora in good taphonomic condition (<50% erosion or encrustation of the skeleton).
Key used in an educational lesson plan for identifying the composition and condition of corals and coralline algae in a core. (a) Two examples of Pocillopora in good taphonomic condition (<50% erosion or encrustation of the skeleton).

Davina Passeri presents poster about coastal change research
Davina Passeri of the St. Petersburg Coastal and Marine Science Center presents a poster about coastal change research in Dauphin Island, Alabama at the USGS Southeast Regional Meeting in February 2020.
Davina Passeri of the St. Petersburg Coastal and Marine Science Center presents a poster about coastal change research in Dauphin Island, Alabama at the USGS Southeast Regional Meeting in February 2020.

Ilsa Kuffner presents a poster on coral research
Ilsa Kuffner speaks to a group at the USGS Southeast Regional Meeting in February 2020 about coral research conducted by the St. Petersburg Coastal and Marine Science Center
Ilsa Kuffner speaks to a group at the USGS Southeast Regional Meeting in February 2020 about coral research conducted by the St. Petersburg Coastal and Marine Science Center

Sediment laboratory at St. Petersburg Coastal & Marine Science Center
The USGS St. Petersburg Coastal and Marine Science Center strives to provide timely, robust science using modern methods and state-of-the-art technologies. This involves keeping our facilities and equipment updated.
The USGS St. Petersburg Coastal and Marine Science Center strives to provide timely, robust science using modern methods and state-of-the-art technologies. This involves keeping our facilities and equipment updated.

Kathryn Smith at an Outreach Event
The USGS St. Petersburg Coastal and Marine Science Center conducted outreach at the Localtopia Event held in February 2020. Staff demonstrated a simulation of how storms can impact sandy coastlines through processes such as erosion.
The USGS St. Petersburg Coastal and Marine Science Center conducted outreach at the Localtopia Event held in February 2020. Staff demonstrated a simulation of how storms can impact sandy coastlines through processes such as erosion.

Shoreline and dune-base forecast locations
Map and graphs illustrating (A) the extent of the shoreline and dune-base forecast locations (red). The year of (B) the first available and (C) most recent shoreline (red) and dune-base (blue) positions are provided for each transect. (D) Total number of shoreline and dune-base positions used in the analysis are also shown. #, number.
Map and graphs illustrating (A) the extent of the shoreline and dune-base forecast locations (red). The year of (B) the first available and (C) most recent shoreline (red) and dune-base (blue) positions are provided for each transect. (D) Total number of shoreline and dune-base positions used in the analysis are also shown. #, number.

Lauren Toth and Julie Richey speak to students about climate change
The St. Petersburg Coastal and Marine Science Center hosted a mini panel discussion of scientists for local children to learn about USGS research, capabilities, and techniques for studying changes in climate across Earth’s history.
The St. Petersburg Coastal and Marine Science Center hosted a mini panel discussion of scientists for local children to learn about USGS research, capabilities, and techniques for studying changes in climate across Earth’s history.
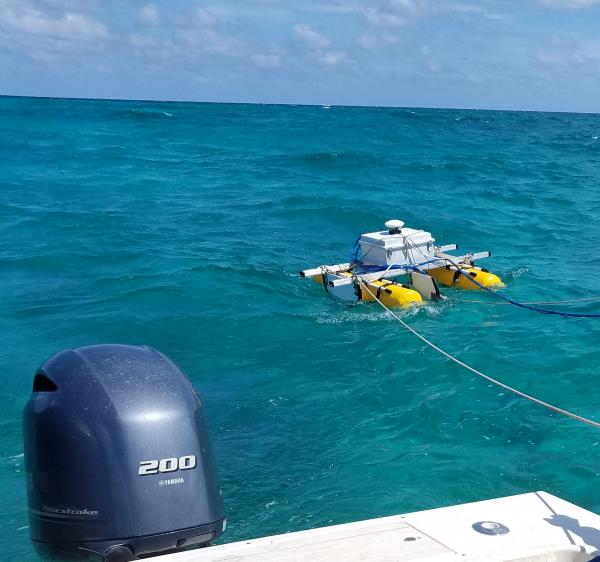
SQUID-5 - Structure-from-Motion Quantitative Underwater Imaging Device
The SQUID-5, or a Structure-from-Motion (SfM) Quantitative Underwater Imaging Device with 5 cameras is a towed surface vehicle with an onboard Global Navigation Satellite System (GNSS) and 5 downward-looking cameras with overlapping views of the seafloor.
The SQUID-5, or a Structure-from-Motion (SfM) Quantitative Underwater Imaging Device with 5 cameras is a towed surface vehicle with an onboard Global Navigation Satellite System (GNSS) and 5 downward-looking cameras with overlapping views of the seafloor.

State of Our Nation’s Coast Stakeholder Engagement Workshop
A group of participants at the Coastal Change Hazards State of Our Nation’s Coast stakeholder engagement workshop at the Waquoit Bay National Estuarine Reserve in Falmouth, MA. Here participants are pictured writing the names of tools they use on sticky notes.
A group of participants at the Coastal Change Hazards State of Our Nation’s Coast stakeholder engagement workshop at the Waquoit Bay National Estuarine Reserve in Falmouth, MA. Here participants are pictured writing the names of tools they use on sticky notes.

State of Our Nation’s Coast Stakeholder Engagement Workshop
Participants of the Coastal Change Hazards State of Our Nation’s Coast stakeholder engagement workshop at the Waquoit Bay National Estuarine Reserve in Falmouth, MA. Participants are pictured here talking in small groups.
Participants of the Coastal Change Hazards State of Our Nation’s Coast stakeholder engagement workshop at the Waquoit Bay National Estuarine Reserve in Falmouth, MA. Participants are pictured here talking in small groups.

Caitlin Reynolds collects samples from sediment trap
Here, Caitlin Reynolds sits on the R/V Pelican next to a sediment trap that collects samples in the Gulf of Mexico.
Here, Caitlin Reynolds sits on the R/V Pelican next to a sediment trap that collects samples in the Gulf of Mexico.

CTD rosette being deployed
A CTD-rosette is a commonly used instrument that measures conductivity (that can inform scientists about salinity), temperature, and depth (CTD). As the instrument is lowered into the water--sometimes down to great depths--the cylinders around will open at various depths to collect water samples at discrete locations throughout the water column.
A CTD-rosette is a commonly used instrument that measures conductivity (that can inform scientists about salinity), temperature, and depth (CTD). As the instrument is lowered into the water--sometimes down to great depths--the cylinders around will open at various depths to collect water samples at discrete locations throughout the water column.

Retrieving a sediment trap in the Gulf of Mexico
A large winch on the stern of R/V Pelican is used to retrieve two sediment traps from the bottom of the Gulf of Mexico.
A large winch on the stern of R/V Pelican is used to retrieve two sediment traps from the bottom of the Gulf of Mexico.

Caitlin Reynolds with a sediment trap in the Gulf of Mexico
Caitlin Reynolds of the USGS St. Petersburg Coastal and Marine Science Center secures a sediment trap, retrieved from the bottom of the Gulf of Mexico on board the R/V Pelican.
Caitlin Reynolds of the USGS St. Petersburg Coastal and Marine Science Center secures a sediment trap, retrieved from the bottom of the Gulf of Mexico on board the R/V Pelican.

Sunset on a research vessel in the Gulf of Mexico
A beautiful sun set over the Gulf of Mexico from the stern of the R/V Pelican.
A beautiful sun set over the Gulf of Mexico from the stern of the R/V Pelican.

SPCMSC Staff Photo, 2020
The USGS St. Petersburg Coastal and Marine Science Center has grown from a core group of geologists and oceanographers to over 100 staff members including biologists, oceanographers, modelers, remote sensing specialists, biogeochemists, microbiologists, coral reef experts, support staff, marine operations crew, data management specialists, and more.
The USGS St. Petersburg Coastal and Marine Science Center has grown from a core group of geologists and oceanographers to over 100 staff members including biologists, oceanographers, modelers, remote sensing specialists, biogeochemists, microbiologists, coral reef experts, support staff, marine operations crew, data management specialists, and more.