
Tropical Storm Eta affected beaches along Florida's Gulf Coast in November 2020. Some dunes were eroded up to several feet due to the high water levels associated with the storm. Madeira Beach is home to many people and animals, and erosion events such as this can affect both habitat and infrastructure.
Images
Images intro.
Filter Total Items: 672

Erosion of dunes following Tropical Storm Eta
Tropical Storm Eta affected beaches along Florida's Gulf Coast in November 2020. Some dunes were eroded up to several feet due to the high water levels associated with the storm. Madeira Beach is home to many people and animals, and erosion events such as this can affect both habitat and infrastructure.

Tropical Storm Eta effects on Madeira Beach, Florida
Tropical Storm Eta had effects on Florida's Gulf Coast beaches, including dune erosion and overwash. This image from the coast cam at Madeira Beach, Florida captured high water levels and resulting overwash of sand onto the patio of the Shoreline Resort.
Tropical Storm Eta had effects on Florida's Gulf Coast beaches, including dune erosion and overwash. This image from the coast cam at Madeira Beach, Florida captured high water levels and resulting overwash of sand onto the patio of the Shoreline Resort.

Ilsa Kuffner SCUBA diving in Dry Tortugas
Dr. Ilsa Kuffner hangs out by a buoy in Dry Tortugas National Park (Florida) over a coral reef. Ilsa visits sites throughout the Florida Keys regularly to measure the growth and survival of nursery planted corals to determine where, and which genetic strains of corals will be most successful in large-scale coral reef restoration efforts.
Dr. Ilsa Kuffner hangs out by a buoy in Dry Tortugas National Park (Florida) over a coral reef. Ilsa visits sites throughout the Florida Keys regularly to measure the growth and survival of nursery planted corals to determine where, and which genetic strains of corals will be most successful in large-scale coral reef restoration efforts.

Elkhorn coral at calcification assessment station in Dry Tortugas
Established in 2009, the U.S. Geological Survey’s Coral Assessment Network (USGS-CAN) provides data on coral-growth (calcification) rates throughout the Florida Keys. Pictured here is one of 30 stations located in in Dry Tortugas National Park.
Established in 2009, the U.S. Geological Survey’s Coral Assessment Network (USGS-CAN) provides data on coral-growth (calcification) rates throughout the Florida Keys. Pictured here is one of 30 stations located in in Dry Tortugas National Park.

Collecting beach profile data in Science Festival video
This screenshot was taken from a video created for the virtual 2020 St. Petersburg Science Festival that discussed Coastal Change Hazards research at the USGS. Justin Birchler is seen walking up the beach with GPS equipment to measure the elevation of the beach.
This screenshot was taken from a video created for the virtual 2020 St. Petersburg Science Festival that discussed Coastal Change Hazards research at the USGS. Justin Birchler is seen walking up the beach with GPS equipment to measure the elevation of the beach.

Wave animation
Waves are the motion of the water's surface, usually caused by the transfer of energy from wind. Wave energy causes the water to move in a circular motion. The height and length of these waves combined with the slope of the beach influence how high the water can reach up on the coast.
Waves are the motion of the water's surface, usually caused by the transfer of energy from wind. Wave energy causes the water to move in a circular motion. The height and length of these waves combined with the slope of the beach influence how high the water can reach up on the coast.

Beach Profile Survey
Justin Birchler, Physical Scientist with the USGS Coastal Change Hazards team conducts a beach profile survey at our field site on Madeira Beach. During these surveys, Justin wears a backpack with GPS equipment to collect elevation data that will be used to create a topographic map of the beach.
Justin Birchler, Physical Scientist with the USGS Coastal Change Hazards team conducts a beach profile survey at our field site on Madeira Beach. During these surveys, Justin wears a backpack with GPS equipment to collect elevation data that will be used to create a topographic map of the beach.

Sea Turtle Nest on Madeira Beach
The USGS Coastal Change Hazards team collects data to monitor coastal change – including how storms and waves shape and reshape our beaches. It’s important to keep track of how beaches change over time because they provide habitat for many creatures including birds and sea turtles, and they are beautiful locations where people love to live and vacation.
The USGS Coastal Change Hazards team collects data to monitor coastal change – including how storms and waves shape and reshape our beaches. It’s important to keep track of how beaches change over time because they provide habitat for many creatures including birds and sea turtles, and they are beautiful locations where people love to live and vacation.

Madeira Beach Camera Time Series
This photo is the results of processing a time series of images, which are a combination of all image frames collected during a 10 to 17-minute video. These images are incredibly useful for studying coastal change remotely, but the usefulness of the image depends on how they are processed.
This photo is the results of processing a time series of images, which are a combination of all image frames collected during a 10 to 17-minute video. These images are incredibly useful for studying coastal change remotely, but the usefulness of the image depends on how they are processed.

Aerial photos of barrier islands
We conduct fieldwork in a variety of barrier island settings to understand the relative importance of these factors, including Fire Island, NY; Rockaway, NY; Seven Mile Island, NJ; and Cedar Island, VA.
We conduct fieldwork in a variety of barrier island settings to understand the relative importance of these factors, including Fire Island, NY; Rockaway, NY; Seven Mile Island, NJ; and Cedar Island, VA.

USGS Scientists Work on Four Tropical Cyclones at Once
In this NOAA satellite image from Sept. 15, 2020, Hurricane Sally approaches the U.S. Gulf Coast, Hurricane Paulettte creates storm waves far out in the Atlantic, and Tropical Storms Teddy and Vicky lie near the coast of Africa. Two tropical depressions are also developing; one of them is not visible in this image.
In this NOAA satellite image from Sept. 15, 2020, Hurricane Sally approaches the U.S. Gulf Coast, Hurricane Paulettte creates storm waves far out in the Atlantic, and Tropical Storms Teddy and Vicky lie near the coast of Africa. Two tropical depressions are also developing; one of them is not visible in this image.

Coastal Change Hazards Portal shows Hurricane Sally near Gulf Coast
As Hurricane Sally approached the US Gulf Coast, the USGS Coastal Change Hazards team produced a series of forecasts for impacts on the beach. Forecasts were updated daily based on wave and storm surge forecasts from NOAA.
As Hurricane Sally approached the US Gulf Coast, the USGS Coastal Change Hazards team produced a series of forecasts for impacts on the beach. Forecasts were updated daily based on wave and storm surge forecasts from NOAA.

Total Water Level and Coastal Change Forecast Expansion, 2020
The Total Water Level and Coastal Change Forecast has continually expanded since real-time forecasts began in 2015. In 2020, new regions of the Gulf and South Atlantic coasts were added to the forecast and officially approved for use in National Weather Service Forecasts.
The Total Water Level and Coastal Change Forecast has continually expanded since real-time forecasts began in 2015. In 2020, new regions of the Gulf and South Atlantic coasts were added to the forecast and officially approved for use in National Weather Service Forecasts.

Aerial image from post-Hurricane Isaias of North Carolina coast
The USGS Remote Sensing Coastal Change Project collected aerial imagery of the northern Outer Banks, North Carolina coastline from pre- and post-Hurricane Isaias, in order to use Structure-from-Motion techniques to produce digital elevation models (DEMs) and orthomosaic photos, to be used in evaluating the storm-induced coastal change, such as sand transported onto
The USGS Remote Sensing Coastal Change Project collected aerial imagery of the northern Outer Banks, North Carolina coastline from pre- and post-Hurricane Isaias, in order to use Structure-from-Motion techniques to produce digital elevation models (DEMs) and orthomosaic photos, to be used in evaluating the storm-induced coastal change, such as sand transported onto
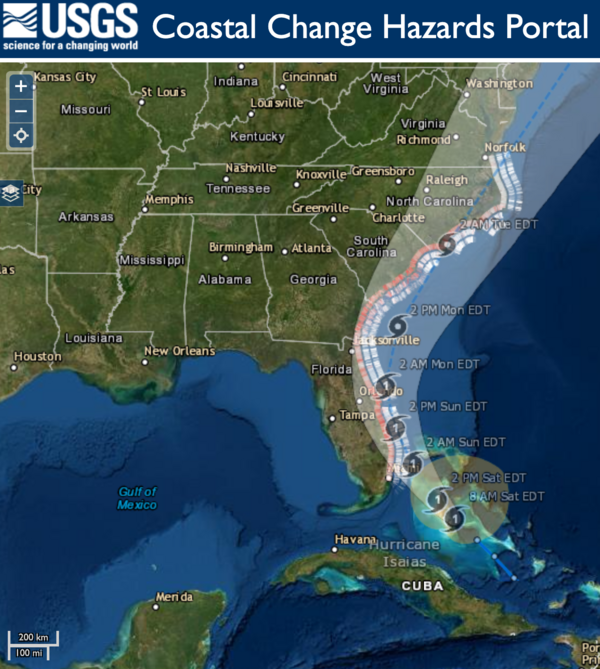
Hurricane Isaias Unlikely to Cause Widespread Atlantic Beach Erosion
USGS coastal change experts predict that storm waves kicked up by the Category 1 hurricane are likely to cause some erosion at the base of the dunes along about 11 percent of coastal beaches between Florida and Virginia.
USGS coastal change experts predict that storm waves kicked up by the Category 1 hurricane are likely to cause some erosion at the base of the dunes along about 11 percent of coastal beaches between Florida and Virginia.

Seamline Appearance Before and After Applying a DEM Fusion Algorithm
A map series showing a subset of the Puerto Rico bathymetric study area. Panels compare a “simple mosaic” formed by overlaying the most recent dataset on top of the older dataset (left panel) with the same dataset processed with the DEM fusion method (right panel).
A map series showing a subset of the Puerto Rico bathymetric study area. Panels compare a “simple mosaic” formed by overlaying the most recent dataset on top of the older dataset (left panel) with the same dataset processed with the DEM fusion method (right panel).

Vegetated dunes on Cocoa Beach, Florida
A view looking north on Cocoa beach towards Kennedy Space Station. Coastal infrastructure and natural resources such as sediment and beach vegetation can all be affected by coastal change processes.
A view looking north on Cocoa beach towards Kennedy Space Station. Coastal infrastructure and natural resources such as sediment and beach vegetation can all be affected by coastal change processes.

A large washover fan on Fire Island, New York in 2012 after Hurricane
Strong storms such as hurricanes can cause drastic changes to coastal environments. For example, this large washover fan was created on Fire Island, New York in 2012 after Hurricane Sandy by waves moving sediment from the dunes and beach towards the back-barrier environment.
Strong storms such as hurricanes can cause drastic changes to coastal environments. For example, this large washover fan was created on Fire Island, New York in 2012 after Hurricane Sandy by waves moving sediment from the dunes and beach towards the back-barrier environment.

Cedar Island, Virginia 1994 - 2014
Cedar Island, Virginia is an uninhabited barrier that has migrated landward approximately 15-30 meters per year since 1984 due to its low sediment supply. The shoreface slope is gradual but almost entirely devoid of island sediment - both responses to its recent, rapid retreat. USGS scientists collect geologic and morphologic data from this island’s shoreface.
Cedar Island, Virginia is an uninhabited barrier that has migrated landward approximately 15-30 meters per year since 1984 due to its low sediment supply. The shoreface slope is gradual but almost entirely devoid of island sediment - both responses to its recent, rapid retreat. USGS scientists collect geologic and morphologic data from this island’s shoreface.

Fire Island, New York 1994 - 2014
Fire Island, New York is sparsely populated and regularly nourished, but has few modifications that impede natural sediment exchanges. Shoreface geomorphology reflects past periods of seaward progradation and alongshore extension resulting in a relatively sediment-rich shoreface. USGS scientists collect geologic and morphologic data from this island’s shoreface.
Fire Island, New York is sparsely populated and regularly nourished, but has few modifications that impede natural sediment exchanges. Shoreface geomorphology reflects past periods of seaward progradation and alongshore extension resulting in a relatively sediment-rich shoreface. USGS scientists collect geologic and morphologic data from this island’s shoreface.