
The Research Vessel Peterson Underway in San Francisco Bay.
Images
Explore water-related photography, imagery, and illustrations.
Filter Total Items: 2414

R/V Peterson Underway in San Francisco Bay
The Research Vessel Peterson Underway in San Francisco Bay.

Lees Ferry streamgage on the Colorado River, Arizona
Lees Ferry streamgage and cableway downstream on the Colorado River, Arizona
Lees Ferry streamgage and cableway downstream on the Colorado River, Arizona

Groundwater Science in the Snow
No matter the season, groundwater science continues! In this March photo, Hydrologic Technician Jeremiah Pomerleau is making groundwater measurements and inspecting the USGS groundwater site monitoring equipment. Due to snowy terrain, Pomerleau used a utility terrain vehicle (UTV) to access the well, requiring a trek of about 15 miles from the main road.
By
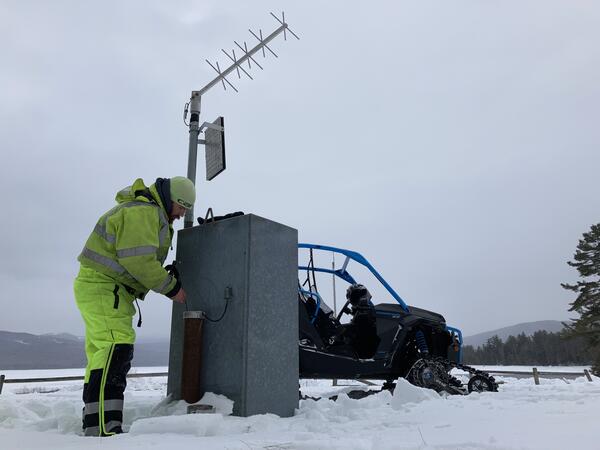
Winter Groundwater Comparisons at Middle Dam, Maine
Hydrologic technician making groundwater measurements and inspecting the USGS groundwater site monitoring equipment.
Hydrologic technician making groundwater measurements and inspecting the USGS groundwater site monitoring equipment.

Modern equipment currently in use at a streamgage on the Ogden River
Modern equipment currently in use at the South Fork of the Ogden River streamgage, to include; an electronic data logger, pressure transducer and GOES radio. This streamgage has been monitoring water levels and flow since March 21, 1921, making it one of 25 centennial gauges in Utah. The equipment used to collect data has changed significantly over the pas
Modern equipment currently in use at the South Fork of the Ogden River streamgage, to include; an electronic data logger, pressure transducer and GOES radio. This streamgage has been monitoring water levels and flow since March 21, 1921, making it one of 25 centennial gauges in Utah. The equipment used to collect data has changed significantly over the pas

Description of the South Fork of the Ogden River streamgage
Description of the South Fork of the Ogden River streamgage included in USGS Water-Supply Paper 530 "Surface Water Supply of the United States, 1921, Part X.
Description of the South Fork of the Ogden River streamgage included in USGS Water-Supply Paper 530 "Surface Water Supply of the United States, 1921, Part X.

100-Year Flood - It's All About Chance
100-Year Flood - It's All About Chance poster image
100-Year Flood - It's All About Chance poster image

January 2021 USGS Active Groundwater Level Network Animation
The USGS Active Groundwater Level Network includes about 20,000 wells that have been measured by the USGS or USGS cooperators at least once within the past 13 months. The animation shows a daily snapshot of water-level statistics in the network for January 2021.
The USGS Active Groundwater Level Network includes about 20,000 wells that have been measured by the USGS or USGS cooperators at least once within the past 13 months. The animation shows a daily snapshot of water-level statistics in the network for January 2021.

Airborne electromagnetic survey, northeastern Wisconsin, January 2021
Photo of helicopter with geophysical equipment loop deployed below it via slingload. In January 2021 a helicopter carried an airborne electromagnetic induction sensor over parts of northeastern Wisconsin as part of a USGS study to map the aquifers in the region.
Photo of helicopter with geophysical equipment loop deployed below it via slingload. In January 2021 a helicopter carried an airborne electromagnetic induction sensor over parts of northeastern Wisconsin as part of a USGS study to map the aquifers in the region.

January 4, 2021, Below Normal Groundwater Levels Network
Map indicates groundwater sites within the USGS Active Groundwater Level network where the most recent groundwater-level measurement is in the 24th percentile or lower in the month of measurement over the period of record for the well.
Map indicates groundwater sites within the USGS Active Groundwater Level network where the most recent groundwater-level measurement is in the 24th percentile or lower in the month of measurement over the period of record for the well.

Freshwater Flow into Chesapeake Bay
High levels of nutrients and sediment can degrade the health of rivers and downstream bodies of water. In this photo of the Rivanna River in Virginia, large amounts of sediment are suspended in the river's water. The Rivanna River flows into the Chesapeake Bay, and too much sediment and/or nutrients can endanger the health of the Bay.
High levels of nutrients and sediment can degrade the health of rivers and downstream bodies of water. In this photo of the Rivanna River in Virginia, large amounts of sediment are suspended in the river's water. The Rivanna River flows into the Chesapeake Bay, and too much sediment and/or nutrients can endanger the health of the Bay.

Solar-powered LoRa cellular gateway
Solar-powered LoRa cellular gateway installed at Pepperwood Preserve to support water and soil moisture sensor deployments in the Santa Rosa, California area
Solar-powered LoRa cellular gateway installed at Pepperwood Preserve to support water and soil moisture sensor deployments in the Santa Rosa, California area

EnviSense with stage sensor at USGS streamgage at Beale Air Force Base near Marysville CA
EnviSense data-logger/transmitter developed by Carnegie Mellon University actively deployed with stage sensor at USGS streamgage at Beale Air Force Base near Marysville, California.
EnviSense data-logger/transmitter developed by Carnegie Mellon University actively deployed with stage sensor at USGS streamgage at Beale Air Force Base near Marysville, California.
Devin McGinty collecting measurements in the field
Devin McGinty collecting measurements in the field including surveying and installing a new staff gage.
Devin McGinty collecting measurements in the field including surveying and installing a new staff gage.

USGS 401723105400000 ANDREWS CREEK - LOCH, VALE-Rocky Mountains

Dr. Graham Sextone downloading weather station data in Rocky Mountains
Dr. Graham Sextone downloading weather station data in Rocky Mountain National Park. Station ID 401719105394311
Dr. Graham Sextone downloading weather station data in Rocky Mountain National Park. Station ID 401719105394311

USGS employee taking surface water measurement at gage 11453500, CA
USGS employee taking surface water measurement at gage 11453500 Putah Creek near Guenoc, CA
USGS employee taking surface water measurement at gage 11453500 Putah Creek near Guenoc, CA

Dave Brower (left) and Taylor Nagleri (right) working on logging data
Dave Brower (left) and Taylor Nagleri (right) working on logging data that was being collected by Rob Lorens in the stream (not pictured).
Dave Brower (left) and Taylor Nagleri (right) working on logging data that was being collected by Rob Lorens in the stream (not pictured).

Katy O’Donnell onboard the RV Landsteiner during a survey
Katy O’Donnell onboard the RV Landsteiner during a high-resolution water quality mapping survey. The boat is equipped with a flow-through system that pumps water onto the boat while underway and directs sample water to a multiparameter water quality sonde, thermosalinograph, fluorometers, nitrate and ammonium analyzers.
Katy O’Donnell onboard the RV Landsteiner during a high-resolution water quality mapping survey. The boat is equipped with a flow-through system that pumps water onto the boat while underway and directs sample water to a multiparameter water quality sonde, thermosalinograph, fluorometers, nitrate and ammonium analyzers.

Brian Bergamaschi, Katy O’Donnell, Emily Richardson, and Jeniffer Soto
(From left to right) Brian Bergamaschi, Katy O’Donnell, Emily Richardson, and Jeniffer Soto Perez onboard the RV Landsteiner during a high-resolution water quality mapping survey.
(From left to right) Brian Bergamaschi, Katy O’Donnell, Emily Richardson, and Jeniffer Soto Perez onboard the RV Landsteiner during a high-resolution water quality mapping survey.