
Jeniffer Soto Perez (left) and Emily Richardson (Right) prepare water quality sample bottles onboard the RV Landsteiner during a high-resolution water quality mapping survey.
Images
Explore water-related photography, imagery, and illustrations.
Filter Total Items: 2414

Jeniffer Soto Perez(left) and Emily Richardson (Right) prepare samples
Jeniffer Soto Perez (left) and Emily Richardson (Right) prepare water quality sample bottles onboard the RV Landsteiner during a high-resolution water quality mapping survey.

Brian Bergamaschi and Katy O’Donnell onboard the RV Landsteiner
Brian Bergamaschi and Katy O’Donnell onboard the RV Landsteiner during a high-resolution water quality mapping survey. The boat is equipped with a flow-through system that pumps water onto the boat while underway and directs sample water to a multiparameter water quality sonde, thermosalinograph, fluorometers, nitrate and ammonium analyzers.
Brian Bergamaschi and Katy O’Donnell onboard the RV Landsteiner during a high-resolution water quality mapping survey. The boat is equipped with a flow-through system that pumps water onto the boat while underway and directs sample water to a multiparameter water quality sonde, thermosalinograph, fluorometers, nitrate and ammonium analyzers.

Hydrologist downloading water-level sensor deployed for summer
Hydrologist downloading water-level sensor deployed for summer as part of an ecohydro study in *H.J. Andrews Experimental Forest. *USGS Integrated Ecohydrological Science - USFS & Oregon State University *Patrick Haluska
Hydrologist downloading water-level sensor deployed for summer as part of an ecohydro study in *H.J. Andrews Experimental Forest. *USGS Integrated Ecohydrological Science - USFS & Oregon State University *Patrick Haluska

USGS staff collecting water samples from the catwalk on Conowingo Dam
USGS staff Dave Brower and Jeff Klein collecting water samples from the catwalk on Conowingo Dam. Streamgage 01578310 Susquehanna River at Conowingo, MD
USGS staff Dave Brower and Jeff Klein collecting water samples from the catwalk on Conowingo Dam. Streamgage 01578310 Susquehanna River at Conowingo, MD

Rebecca Steinberg making her first discharge measurement as a new hire
Rebecca Steinberg making her first discharge measurement as a new hydrologic technician while lake-effect snow creates a winter wonderland at the Cuyahoga River, Hiram Ohio gage station 04202000. An American flag is peaking out in the background.
Rebecca Steinberg making her first discharge measurement as a new hydrologic technician while lake-effect snow creates a winter wonderland at the Cuyahoga River, Hiram Ohio gage station 04202000. An American flag is peaking out in the background.

Hydrologic Technician measures discharge in Ashwaubenon Creek, WI
Hydrologic Technician Matt Bach measures discharge in Ashwaubenon Creek near Little Rapids, WI (NWIS site: 04085068) on May 21, 2020, as part of a cooperative project with NEWWater (Green Bay Metropolitan Sewage District) utilizing an adaptive management approach to meet phosp
Hydrologic Technician Matt Bach measures discharge in Ashwaubenon Creek near Little Rapids, WI (NWIS site: 04085068) on May 21, 2020, as part of a cooperative project with NEWWater (Green Bay Metropolitan Sewage District) utilizing an adaptive management approach to meet phosp

Hydrologic Technician measures discharge in Ashwaubenon Creek, WI (2)
Hydrologic Technician Matt Bach measures discharge in Ashwaubenon Creek near Little Rapids, WI (NWIS site: 04085068) on May 21, 2020, as part of a cooperative project with NEWWater (Green Bay Metropolitan Sewage District) utilizing an adaptive management approach to meet phosp
Hydrologic Technician Matt Bach measures discharge in Ashwaubenon Creek near Little Rapids, WI (NWIS site: 04085068) on May 21, 2020, as part of a cooperative project with NEWWater (Green Bay Metropolitan Sewage District) utilizing an adaptive management approach to meet phosp

Katy O’Donnell monitors readings from water quality instrument
Katy O’Donnell monitors readings from different instruments of the flow-through system during a high-resolution water quality mapping survey onboard the RV Landsteiner along the Sacramento River in West Sacramento, CA.
Katy O’Donnell monitors readings from different instruments of the flow-through system during a high-resolution water quality mapping survey onboard the RV Landsteiner along the Sacramento River in West Sacramento, CA.

Brian Bergamaschi and Katy O’Donnell onboard the RV Landsteiner
Brian Bergamaschi and Katy O’Donnell onboard the RV Landsteiner during a high-resolution water quality mapping survey. The boat is equipped with a flow-through system that pumps water onto the boat while underway and directs sample water to a multiparameter water quality sonde, thermosalinograph, fluorometers, nitrate and ammonium analyzers.
Brian Bergamaschi and Katy O’Donnell onboard the RV Landsteiner during a high-resolution water quality mapping survey. The boat is equipped with a flow-through system that pumps water onto the boat while underway and directs sample water to a multiparameter water quality sonde, thermosalinograph, fluorometers, nitrate and ammonium analyzers.

December 2020 USGS Active Groundwater Level Network Animation
The USGS Active Groundwater Level Network includes about 20,000 wells that have been measured by the USGS or USGS cooperators at least once within the past 13 months. The animation shows a daily snapshot of water-level statistics in the network for December 2020.
The USGS Active Groundwater Level Network includes about 20,000 wells that have been measured by the USGS or USGS cooperators at least once within the past 13 months. The animation shows a daily snapshot of water-level statistics in the network for December 2020.

Strontium measured in wells tapping U.S. principal aquifers
Concentrations of strontium in samples of groundwater from drinking-water wells and shallow monitoring wells.
Concentrations of strontium in samples of groundwater from drinking-water wells and shallow monitoring wells.

Launching an autonomous underwater vehicle in the Delaware River
USGS scientists Matt Gyves (left) and Jason Shvanda (center) deploying a low-cost, small uncrewed underwater vehicle (sUUV) to autonomously measure water quality parameters in the Delaware River with Ian Owen from Jaia Robotics (right).
USGS scientists Matt Gyves (left) and Jason Shvanda (center) deploying a low-cost, small uncrewed underwater vehicle (sUUV) to autonomously measure water quality parameters in the Delaware River with Ian Owen from Jaia Robotics (right).

November 2020 Active Groundwater Level Network Animation
The USGS Active Groundwater Level Network includes about 20,000 wells that have been measured by the USGS or USGS cooperators at least once within the past 13 months. The animation shows a daily snapshot of water-level statistics in the network for November 2020.
The USGS Active Groundwater Level Network includes about 20,000 wells that have been measured by the USGS or USGS cooperators at least once within the past 13 months. The animation shows a daily snapshot of water-level statistics in the network for November 2020.

October 2020 Active Groundwater Level Network Animation
The USGS Active Groundwater Level Network includes about 20,000 wells that have been measured by the USGS or USGS cooperators at least once within the past 13 months. The animation shows a daily snapshot of water-level statistics in the network for October 2020.
The USGS Active Groundwater Level Network includes about 20,000 wells that have been measured by the USGS or USGS cooperators at least once within the past 13 months. The animation shows a daily snapshot of water-level statistics in the network for October 2020.

Collecting a red-dye sample in Olathe, Kansas
USGS scientist uses a weighted basket sampler to collect a Time of Travel red-dye sample at WaterOne in Olathe, Kansas.
USGS scientist uses a weighted basket sampler to collect a Time of Travel red-dye sample at WaterOne in Olathe, Kansas.
USGS scientist prepares to collect a red-dye sample in Olathe, Kansas
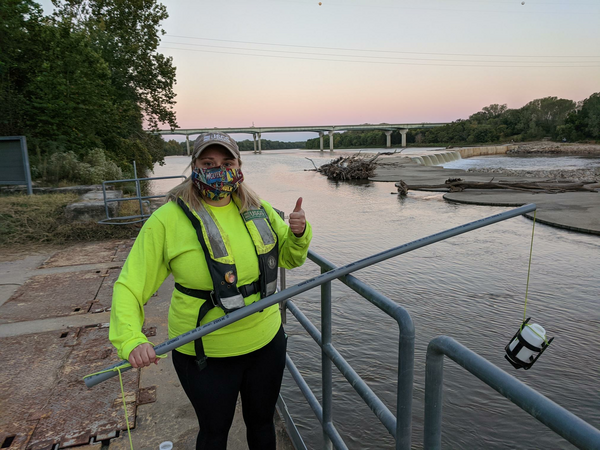
USGS scientist Chantelle Davis prepares to collect a red-dye sample, at sunrise, for the Time of Travel study in Olathe, Kansas.
USGS scientist Chantelle Davis prepares to collect a red-dye sample, at sunrise, for the Time of Travel study in Olathe, Kansas.

September 2020 Active Groundwater Level Network Animation
The USGS Active Groundwater Level Network includes about 20,000 wells that have been measured by the USGS or USGS cooperators at least once within the past 13 months. The animation shows a daily snapshot of water-level statistics in the network for September 2020.
The USGS Active Groundwater Level Network includes about 20,000 wells that have been measured by the USGS or USGS cooperators at least once within the past 13 months. The animation shows a daily snapshot of water-level statistics in the network for September 2020.
Samples collected during the red-dye study trial run in Desoto, Kansas
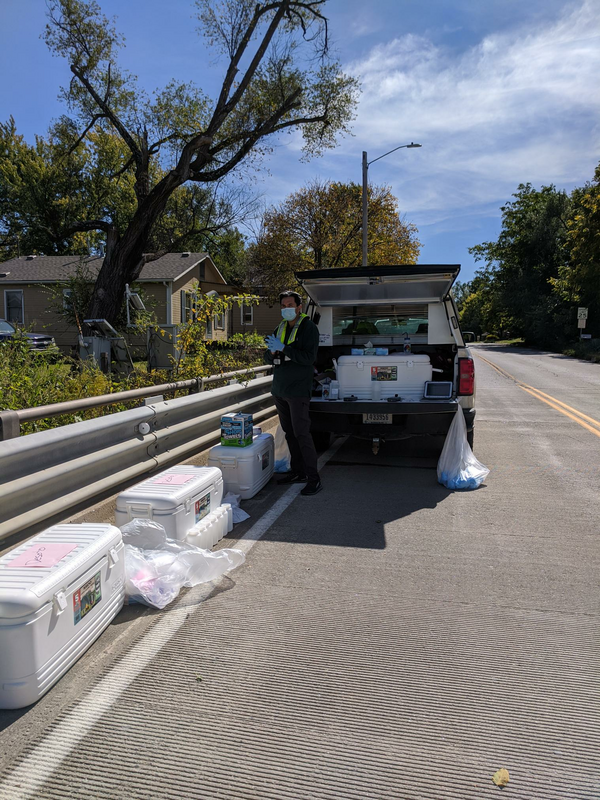
USGS scientist watches over the many samples collected during the red-dye study trial run in Desoto, Kansas while he awaits the next sample.
USGS scientist watches over the many samples collected during the red-dye study trial run in Desoto, Kansas while he awaits the next sample.
Getting a field fluorometer reading from a red-dye study sample
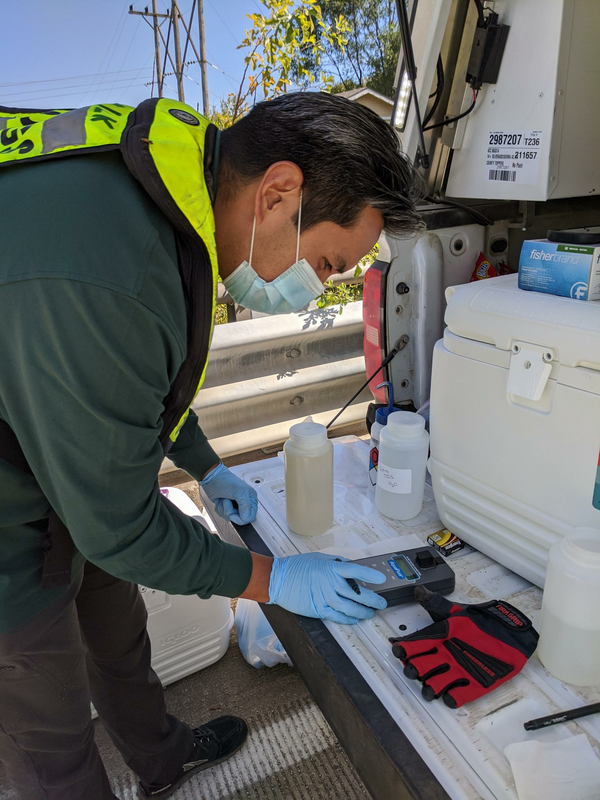
USGS scientist Ian Gambill gets a field fluorometer reading from a recently collected red-dye study sample from the Kansas River in DeSoto, Kansas.
USGS scientist Ian Gambill gets a field fluorometer reading from a recently collected red-dye study sample from the Kansas River in DeSoto, Kansas.

USGS Testing ground-penetrating radar (GPR) on a cableway
In September 2020 USGS tested ground-penetrating radar (GPR) mounted on a cableway over the Gunnison River in Colorado. USGS has been testing use of the GPR to map river bathymetry (profiles of water depth along the river), measurements often made by personnel in the water or on boats.
In September 2020 USGS tested ground-penetrating radar (GPR) mounted on a cableway over the Gunnison River in Colorado. USGS has been testing use of the GPR to map river bathymetry (profiles of water depth along the river), measurements often made by personnel in the water or on boats.

Hurricane Sally Water Footprint Data Visualization
Watch Hurricane Sally move through the southeast U.S. in this data visualization, and see USGS streamgage measurements spike as the storm’s extreme rainfall leads to intense flooding. USGS streamgages provide critical information during storms to flood forecasters and emergency managers as they make decisions that contributes to protecting lives and property.
Watch Hurricane Sally move through the southeast U.S. in this data visualization, and see USGS streamgage measurements spike as the storm’s extreme rainfall leads to intense flooding. USGS streamgages provide critical information during storms to flood forecasters and emergency managers as they make decisions that contributes to protecting lives and property.