
The USGS Active Groundwater Level Network includes about 20,000 wells that have been measured by the USGS or USGS cooperators at least once within the past 13 months. The animation shows snapshots of water-level statistics in the network during December 2021.
Images
Explore water-related photography, imagery, and illustrations.
Filter Total Items: 2414

December 2021 USGS Active Groundwater Level Network Animation
The USGS Active Groundwater Level Network includes about 20,000 wells that have been measured by the USGS or USGS cooperators at least once within the past 13 months. The animation shows snapshots of water-level statistics in the network during December 2021.

U.S. Groundwater Conditions data visualization
This is a still image from the U.S. Groundwater Conditions animated data visualization, which depicts groundwater levels at 2,281 well sites across the U.S.
This is a still image from the U.S. Groundwater Conditions animated data visualization, which depicts groundwater levels at 2,281 well sites across the U.S.

U.S. Groundwater Conditions Data Visualization Thumbnail Image
This is a still image representing an animated data visualization. The full data visualization animates groundwater levels at 2281 well sites across the U.S.
This is a still image representing an animated data visualization. The full data visualization animates groundwater levels at 2281 well sites across the U.S.

Plot of decadal change in Radium concentration vs. road salt application rate
Graph of decadal change in Radium concentration compared to road salt application rate (Lindsay and others, 2021). Increases in concentrations of radium are correlated with road-salt application, and multiple lines of evidence support that the relation is causal.
Graph of decadal change in Radium concentration compared to road salt application rate (Lindsay and others, 2021). Increases in concentrations of radium are correlated with road-salt application, and multiple lines of evidence support that the relation is causal.

USGS Hydrologist Collects Groundwater Sample at Idaho National Laboratory
In this photo USGS hydrologist Allison Trcka collects a groundwater sample at the Idaho National Laboratory in November 2021. Since 1949, the USGS has partnered with the U.S.
In this photo USGS hydrologist Allison Trcka collects a groundwater sample at the Idaho National Laboratory in November 2021. Since 1949, the USGS has partnered with the U.S.

Puerto Rico’s North Coast Aqueduct interconnections
Locations of Puerto Rico’s North Coast Aqueduct interconnections and water transferred, in million gallons per day (Mgal/d) in 2015.
Locations of Puerto Rico’s North Coast Aqueduct interconnections and water transferred, in million gallons per day (Mgal/d) in 2015.

Robert (Bo) Bales works on a Aquadopp for deployment
Photo Contest Winner | September 2021 | People
Robert (Bo) Bales works on a Aquadopp for deployment
Photo Contest Winner | September 2021 | People
Robert (Bo) Bales works on a Aquadopp for deployment

Vehicles drive on Interstate 70 in Glenwood Canyon, Colorado
Vehicles drive on interstate I-70 in Glenwood Canyon, Colorado. In the summer of 2021, travelers in Colorado's Glenwood Canyon were safely evacuated before massive debris flows buried highways and destroyed bridges, thanks to a debris flow warning system developed in part by the U.S. Geological Survey.
Vehicles drive on interstate I-70 in Glenwood Canyon, Colorado. In the summer of 2021, travelers in Colorado's Glenwood Canyon were safely evacuated before massive debris flows buried highways and destroyed bridges, thanks to a debris flow warning system developed in part by the U.S. Geological Survey.

Thermal Infrared Drone Images Near Farmington River, Connecticut
a) A thermal infrared orthomoasic image generated from drone-based data collected over a wetland in the Farmington River headwaters, Connecticut. The data indicate multi-scale preferential groundwater discharge processes.
a) A thermal infrared orthomoasic image generated from drone-based data collected over a wetland in the Farmington River headwaters, Connecticut. The data indicate multi-scale preferential groundwater discharge processes.

November 2021 USGS Active Groundwater Level Network Animation
The USGS Active Groundwater Level Network includes about 20,000 wells that have been measured by the USGS or USGS cooperators at least once within the past 13 months. The animation shows snapshots of water-level statistics in the network during November 2021.
The USGS Active Groundwater Level Network includes about 20,000 wells that have been measured by the USGS or USGS cooperators at least once within the past 13 months. The animation shows snapshots of water-level statistics in the network during November 2021.

Nebraska Water Dashboard screenshot
Screenshot of Nebraska water dashboard. This image was added to use as an example of a resource on the Nebraska Water Science Center Home page.
Screenshot of Nebraska water dashboard. This image was added to use as an example of a resource on the Nebraska Water Science Center Home page.
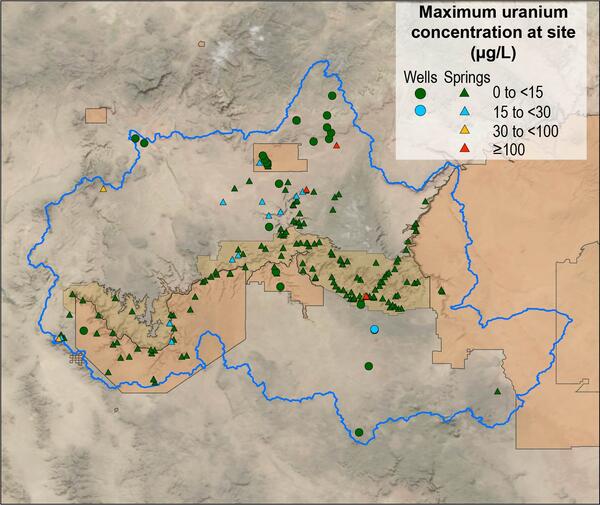
Map of Grand Canyon uranium concentrations as spring and well sites
Map of maximum uranium concentration at 206 spring and well sites in the Grand Canyon region.
Map of maximum uranium concentration at 206 spring and well sites in the Grand Canyon region.

October 2021 USGS Active Groundwater Level Network Animation
The USGS Active Groundwater Level Network includes about 20,000 wells that have been measured by the USGS or USGS cooperators at least once within the past 13 months. The animation shows snapshots of water-level statistics in the network during Octobers 2021.
The USGS Active Groundwater Level Network includes about 20,000 wells that have been measured by the USGS or USGS cooperators at least once within the past 13 months. The animation shows snapshots of water-level statistics in the network during Octobers 2021.

USGS Scientist Conducts Groundwater Slug Test
In this photo, USGS scientist Martha Nielsen conducts a slug test in a groundwater well completed in bedrock. During a slug test, a hydrologist causes the water level in a well to increase or decrease rapidly, while measuring the water-level response in the well over time.
In this photo, USGS scientist Martha Nielsen conducts a slug test in a groundwater well completed in bedrock. During a slug test, a hydrologist causes the water level in a well to increase or decrease rapidly, while measuring the water-level response in the well over time.

Kenna Grubb measuring on the Holston River
Photo Contest Winner | September 2021 | Honorable Mention 1
Kenna Grubb measuring on the Holston River
Photo Contest Winner | September 2021 | Honorable Mention 1
Kenna Grubb measuring on the Holston River

Ruby Lake National Wildlife Reserve
Ruby Lake National Wildlife Refuge lies at the southern end of Ruby Valley in northeast Nevada. For more information visit the Ruby Lake NWR website.
By
Ecosystems Mission Area, Water Resources Mission Area, Land Management Research Program, Water Availability and Use Science Program, Climate Adaptation Science Centers, Forest and Rangeland Ecosystem Science Center, Fort Collins Science Center, Nevada Water Science Center, Oregon Water Science Center, Utah Water Science Center, Western Ecological Research Center (WERC), Saline Lakes Ecosystems Integrated Water Availability Assessment

September 2021 USGS Active Groundwater Level Network Animation
The USGS Active Groundwater Level Network includes about 20,000 wells that have been measured by the USGS or USGS cooperators at least once within the past 13 months. The animation shows snapshots of water-level statistics in the network during September 2021.
The USGS Active Groundwater Level Network includes about 20,000 wells that have been measured by the USGS or USGS cooperators at least once within the past 13 months. The animation shows snapshots of water-level statistics in the network during September 2021.

Hydrologic Instrumentation Facility Architectural Rendering: Eyelevel View
An architectural rendering of the new Hydrologic Instrumentation Facility building in Tuscaloosa, Alabama.
An architectural rendering of the new Hydrologic Instrumentation Facility building in Tuscaloosa, Alabama.

Hydrologic Instrumentation Facility Architectural Rendering: Building Exterior
An architectural rendering of the new Hydrologic Instrumentation Facility building in Tuscaloosa, Alabama.
An architectural rendering of the new Hydrologic Instrumentation Facility building in Tuscaloosa, Alabama.

Hydrologic Instrumentation Facility Architectural Rendering: Building Front
An architectural rendering of the new Hydrologic Instrumentation Facility building in Tuscaloosa, Alabama.
An architectural rendering of the new Hydrologic Instrumentation Facility building in Tuscaloosa, Alabama.

Hydrologic Instrumentation Facility Architectural Rendering: Building Entrance
An architectural rendering of the new Hydrologic Instrumentation Facility building in Tuscaloosa, Alabama.
An architectural rendering of the new Hydrologic Instrumentation Facility building in Tuscaloosa, Alabama.