
Bussell, Ashley M working on site, with Blue USGS Shirt.
Images
Explore water-related photography, imagery, and illustrations.
Filter Total Items: 2402

Ashley Bussell working in the field
Bussell, Ashley M working on site, with Blue USGS Shirt.

New Gulf of Mexico network speeds USGS hurricane preparations
Each one these blue dots represents a site where a storm-tide sensor bracket has been installed for the Gulf of Mexico pre-defined network. There are currently 85 brackets in Florida, 6 in Alabama, 3 in Mississippi, 18 in Louisiana and 26 in Texas, for a total of 138 bracketed sites. (Not all brackets will be used in all storms.)
Each one these blue dots represents a site where a storm-tide sensor bracket has been installed for the Gulf of Mexico pre-defined network. There are currently 85 brackets in Florida, 6 in Alabama, 3 in Mississippi, 18 in Louisiana and 26 in Texas, for a total of 138 bracketed sites. (Not all brackets will be used in all storms.)

This Flood Event Viewer is a one-stop information source
The USGS creates a Flood Event Viewer for major flooding incidents, as a one-stop, interactive information source. On that website, viewers can click on each red dot (storm-tide sensor) to see details about it.
The USGS creates a Flood Event Viewer for major flooding incidents, as a one-stop, interactive information source. On that website, viewers can click on each red dot (storm-tide sensor) to see details about it.

Collecting flood data on the Llano River in response to a flash flood
USGS scientist Scott Grzyb reviews high-water data collected by boat on the Llano River in Llano, Texas in response to a flash flood on October 8, 2018.
USGS scientist Scott Grzyb reviews high-water data collected by boat on the Llano River in Llano, Texas in response to a flash flood on October 8, 2018.

End of a long day collecting flood data on the Llano River
USGS scientists Scrott Grzyb and Michael Scheider pause at sunset at the end of a long day collecting high-water measurements along the Llano River on October 8, 2018.
USGS scientists Scrott Grzyb and Michael Scheider pause at sunset at the end of a long day collecting high-water measurements along the Llano River on October 8, 2018.

USGS science on a map of the Carolinas after Hurricane Florence
This flood event viewer map, dated Oct. 3, 2018, shows the extent and type of information collected by USGS hydrologists in North and South Carolina in the wake of historic flooding brought on by Hurricane Florence.
This flood event viewer map, dated Oct. 3, 2018, shows the extent and type of information collected by USGS hydrologists in North and South Carolina in the wake of historic flooding brought on by Hurricane Florence.

Boy getting tap water
Boy getting tap drinking water. From The USGS Floridian Circular 1355 "Water Quality in the Upper Floridian Aquifer and Overlying Surficial Aquifers, Southeastern United States, 1993-2010."
Boy getting tap drinking water. From The USGS Floridian Circular 1355 "Water Quality in the Upper Floridian Aquifer and Overlying Surficial Aquifers, Southeastern United States, 1993-2010."

Flooding at Vekol Wash, Arizona
Flooding at Vekol Wash today, south of Phoenix, following remnant rains from Hurricane Rosa.
Flooding at Vekol Wash today, south of Phoenix, following remnant rains from Hurricane Rosa.

Fair weather cumulus at Chester County, PA Observation Well CH 10
Chester County, Pennsylvania Observation Well CH 10. The well is 33.5 feet deep, and lies in the local Cockeysville Marble Aquifer, part of the larger Piedmont and Blue Ridge carbonate-rock National Aquifer. The well is relatively new to the Groundwater Quality Monitoring Network (GWMN) consisting of 27 wells distributed over 26 counties in Pennsylvania.
Chester County, Pennsylvania Observation Well CH 10. The well is 33.5 feet deep, and lies in the local Cockeysville Marble Aquifer, part of the larger Piedmont and Blue Ridge carbonate-rock National Aquifer. The well is relatively new to the Groundwater Quality Monitoring Network (GWMN) consisting of 27 wells distributed over 26 counties in Pennsylvania.

An algal bloom near the Ash River Visitor Center at Kabetogama Lake
An algal bloom near the Ash River Visitor Center at Kabetogama Lake, where visitors enjoy picnics and trails year-round.
An algal bloom near the Ash River Visitor Center at Kabetogama Lake, where visitors enjoy picnics and trails year-round.

Double-checking a high water mark on a church door near Maxton, NC
USGS hydrographer Daniel McCay uses a level to double-check a high water mark on a church door near Maxton, NC as his USGS colleague Mary Winsor observes on Sept. 25, 2018, in the wake of flooding brought on by Hurricane Florence.
USGS hydrographer Daniel McCay uses a level to double-check a high water mark on a church door near Maxton, NC as his USGS colleague Mary Winsor observes on Sept. 25, 2018, in the wake of flooding brought on by Hurricane Florence.

A high water mark above the eaves of a Spring Hill, NC house
USGS hydrologic technician Rob Forde flags a high water mark above the eaves at Presbyterian Church of the Covenant, 118 Manchester Road, Spring Hill, North Carolina on Sept. 21, 2018, in the wake of flooding brought on by Hurricane Florence.
USGS hydrologic technician Rob Forde flags a high water mark above the eaves at Presbyterian Church of the Covenant, 118 Manchester Road, Spring Hill, North Carolina on Sept. 21, 2018, in the wake of flooding brought on by Hurricane Florence.

Measuring a high water mark as flooding recedes
USGS hydrographer Kyle Marchman measures a high water mark on the rear wall of a Kangaroo gas station on Highway 24 north of Fayetteville, NC on Sept. 18, 2018, after flooding caused by Hurricane Florence.
USGS hydrographer Kyle Marchman measures a high water mark on the rear wall of a Kangaroo gas station on Highway 24 north of Fayetteville, NC on Sept. 18, 2018, after flooding caused by Hurricane Florence.

Measuring the Lumber River floodwaters
James Stonecypher measures flood waters from the Lumber River that breached a dam in Lumberton, North Carolina after the passage of Hurricane Florence, Sept. 17, 2018.
James Stonecypher measures flood waters from the Lumber River that breached a dam in Lumberton, North Carolina after the passage of Hurricane Florence, Sept. 17, 2018.
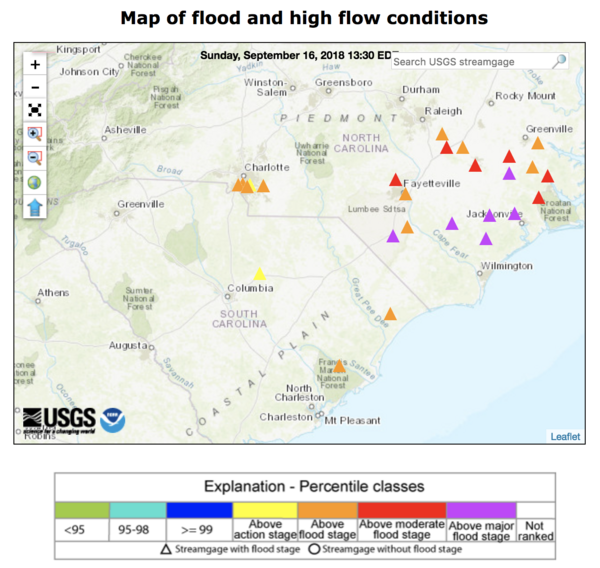
As Florence rains, rivers keep rising, submerging some USGS instrument
A WaterWatch web map shows streamgages in North and South Carolina that approached or exceeded major flood stage EST on September 19, 2018, as the former Hurricane Florence, now downgraded to a tropical depression, deluged the states with rain.
A WaterWatch web map shows streamgages in North and South Carolina that approached or exceeded major flood stage EST on September 19, 2018, as the former Hurricane Florence, now downgraded to a tropical depression, deluged the states with rain.

Working to keep vital flood information flowing in the Carolinas
David Stillwell, USGS hydrologic technician, performs a discharge measurement to help document and forecast flooding caused by Hurricane Florence at Long Creek in Rhyne, North Carolina on Sept. 16.
David Stillwell, USGS hydrologic technician, performs a discharge measurement to help document and forecast flooding caused by Hurricane Florence at Long Creek in Rhyne, North Carolina on Sept. 16.

Water Availability and Use Program Studies
Map of Water Availability and Use Program Studies from USGS Circular 1440 "Continuing Progress toward a national Assessment of Water Availability and Use."
Map of Water Availability and Use Program Studies from USGS Circular 1440 "Continuing Progress toward a national Assessment of Water Availability and Use."

USGS Storm-Tide Sensor for Hurricane Florence
A USGS storm-tide sensor, deployed in advance of Hurricane Florence's landfall. The sensors are housed in vented steel pipes a few inches wide and about a foot long. They are being installed on bridges, piers, and other structures that have a good chance of surviving the storm.
A USGS storm-tide sensor, deployed in advance of Hurricane Florence's landfall. The sensors are housed in vented steel pipes a few inches wide and about a foot long. They are being installed on bridges, piers, and other structures that have a good chance of surviving the storm.

Prescription medication
Hormones and pharmaceuticals, widely used for treatment of humans, domestic animals, and livestock, have the potential to enter the environment, including groundwater. In 2009, nearly 70% of Americans took at least one prescription drug, and more than half took 2 or more.
Hormones and pharmaceuticals, widely used for treatment of humans, domestic animals, and livestock, have the potential to enter the environment, including groundwater. In 2009, nearly 70% of Americans took at least one prescription drug, and more than half took 2 or more.

LSPIV camera setup over USGS gage 09333500 Dirty Devil River, UT
LSPIV camera setup over USGS gage 09333500 Dirty Devil River above Poison Springs Wash nr Hanksville, UT.

Water budget visualization for Buck Creek-Delaware River
Example water budget visualization for Buck Creek-Delaware River showing the difference between inflow and outflow components. Full visualization application is located at https://cida.usgs.gov/nwc-static/waterbudget-viz/
Example water budget visualization for Buck Creek-Delaware River showing the difference between inflow and outflow components. Full visualization application is located at https://cida.usgs.gov/nwc-static/waterbudget-viz/